Hand over the prompt and the criteria and a premium original sample arrives within 24 to 48 hours, with your organization diagnosed as a system, every framework credited to the scholar who built it, and revisions carried until the guide is satisfied. On the transcript this course appears as EDD FPX 8020, The Dynamics of Organizational Improvement, worth 2 program points, one of the five courses in the doctoral core of the Capella EdD with the Educational Leadership specialization, delivered in FlexPath inside a required 32-point sequence. In Capella's catalog the course code is written EDD-FPX8020.
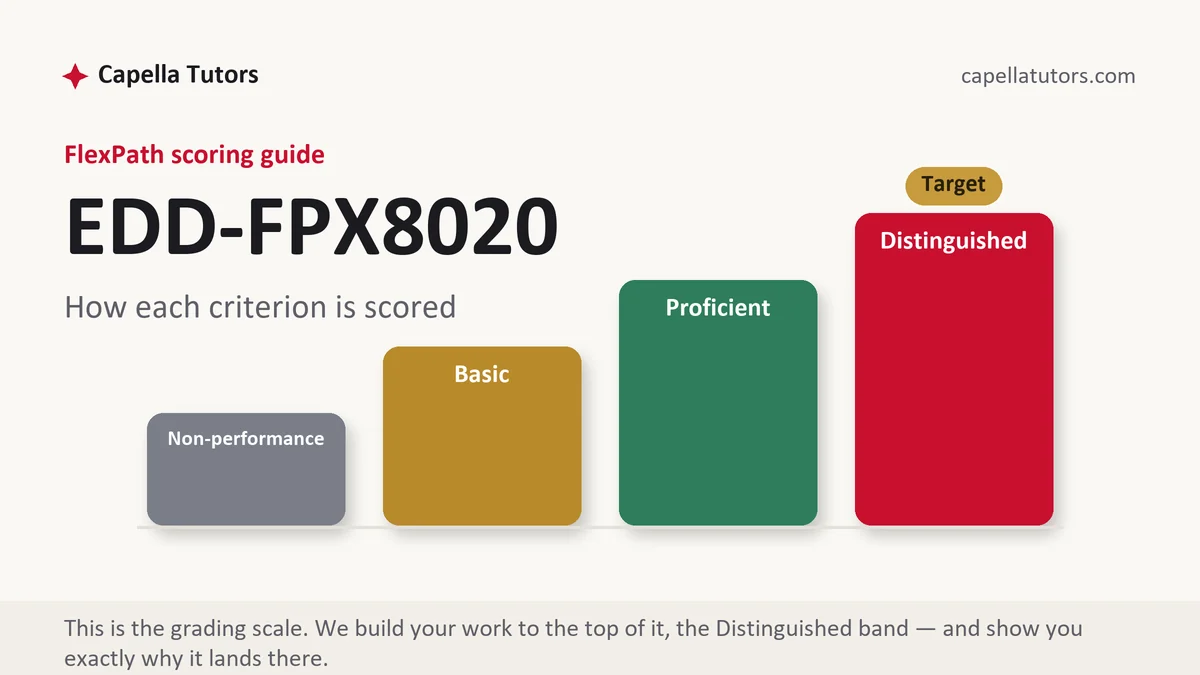
What EDD FPX 8020 actually grades
The premise of this course is that your organization is currently getting exactly the results its design produces, and the criteria are written to see whether you can say what that design is. Diagnosis outranks enthusiasm here. Chris Argyris and Donald Schön gave education its sharpest tool for this in Organizational Learning in 1978 when they separated single-loop learning, which corrects an error while leaving the governing assumptions untouched, from double-loop learning, which puts those assumptions themselves on the table. A school that responds to failing algebra scores by adding a tutoring block is looping once. A school that asks why algebra is scheduled, staffed and sequenced the way it is has looped twice, and the second question is the one that carries a doctoral criterion.
The second graded strand is structural realism about how schools actually transmit decisions. Karl Weick described educational organizations as loosely coupled systems in Administrative Science Quarterly in 1976, and the phrase explains most of the failures you will be asked to analyze: the office and the classroom are connected, but weakly and slowly, so a policy can be adopted, announced, budgeted and still never reach a lesson. Lee Bolman and Terrence Deal supply the complementary move in Reframing Organizations, where the same event is read through structural, human resource, political and symbolic frames. Most submitted work uses one frame without noticing, usually the structural one, and produces a recommendation about org charts for a problem that was political all along.
Improvement science is the third strand and the one that most often distinguishes a top-column paper. Anthony Bryk, Louis Gomez, Alicia Grunow and Paul LeMahieu set out its discipline in Learning to Improve in 2015: make the work problem-specific and user-centred, see the system that produces the current outcomes, measure enough to know whether a change is an improvement, run disciplined inquiry cycles, and organize the effort as a network rather than a heroic project. The cycle itself descends from Walter Shewhart by way of W. Edwards Deming, which is worth citing correctly rather than calling it a generic planning loop. Set against that, Cynthia Coburn's 2003 article in Educational Researcher reframes scale as four things at once, depth of change in practice, sustainability, spread, and a shift in ownership to the people doing the work, and it is the reference that stops a paper from equating scale with headcount.
Change models are graded as instruments rather than as furniture. John Kotter's eight steps from Leading Change in 1996 describe a sequence and assume the destination is known. Ronald Heifetz argued in Leadership Without Easy Answers in 1994 that the harder category is adaptive work, where the problem sits in the values and habits of the people who have it and no expert can solve it on their behalf. Everett Rogers explains why the same innovation moves fast in one building and stalls in another. Naming the model you used, saying what it revealed, and saying where it stopped being useful is a stronger paragraph than a faithful recital of any of them.
How we help in this course
An 8020 draft from this studio diagnoses before it prescribes. Your organization is described as a set of routines and incentives that reliably produce today's result, each assigned framework is used as an instrument instead of being displayed as a summary, and any change proposed carries the measures that would reveal whether it worked. Send your setting, your position in it, and the initiative you are being asked to analyze, and the sample argues about that organization rather than about schools in the abstract.
Commercial terms do not vary between courses. Delivery in 24 to 48 hours, written against the highest descriptor in the guide you were issued, moved through eight readers with one assigned purely to verifying that every framework is attributed to the person who published it, and unlimited free revision until the criteria are met. Anything faculty send back is handled inside the same arrangement at no cost.
The assessments, one by one
Assessment 1
Assessment 1 of EDD FPX 8020, The Dynamics of Organizational Improvement, is a diagnosis rather than a plan. Read the full Assessment 1 manual.
Assessment 2
Assessment 2 of EDD FPX 8020 puts the theory to work on something that already failed. Read the full Assessment 2 manual.
Assessment 3
Assessment 3 of EDD FPX 8020 is where the diagnosis has to become something testable. Read the full Assessment 3 manual.
How to actually write EDD FPX 8020: where to begin
Start from the guide and let it decide the architecture, because the failure mode in this course is a well-written description of an initiative where a diagnosis of a system was wanted. Convert each criterion into a heading, drop the top descriptor underneath it, and check every paragraph against the question of whether it explains the current result or merely narrates a plan. The assessments in this course usually ask you to examine an organization you know, to apply named theory to what you find, and to propose improvement that could be evaluated, and your scoring guide decides how much weight sits on each. If your paper never states why the problem persists despite previous attempts to fix it, the diagnosis criterion has nothing to reward.
Then build a driver diagram before you write, since it forces the causal logic into the open and gives the paper its spine. Take a middle school where 22 percent of students missed at least ten percent of enrolled days last year. The aim is written with a number and a date: reduce chronic absence to 15 percent by the end of next school year. The primary drivers are the things that would have to change for that to happen, which here are the attendance routine itself, family contact, students' sense of belonging in the building, and health and transport barriers. Under each sits a secondary driver, so family contact breaks into speed of first contact, language access, and whether contact is punitive or supportive. Only then do change ideas appear, such as a same-day call within the first two hours by a named adult who knows the student. Written this way, every recommendation in your paper is traceable to a driver and every driver is traceable to the aim, and a reader can attack the theory rather than the wording.
Then attach three kinds of measure, because a criterion about evaluating improvement is nearly always present and nearly always answered thinly. The outcome measure is the aim restated, which is the percentage chronically absent, and it moves slowly. Process measures track whether the change is actually happening, so the share of absences receiving a same-day call within two hours, reported weekly, tells you in a fortnight what the outcome will not tell you for a term. The balancing measure watches what the change might be quietly damaging, which in this example is the counselling time being consumed by phone calls, and including one is the single clearest signal to an evaluator that you understand the difference between activity and improvement. Say which staff member owns each measure and where the number will come from, and take the definitional care described in EDD FPX 8050 before quoting any of them.
| Section | What goes in it | What Distinguished looks like |
|---|---|---|
| The organization as it works now | Structure, routines, incentives, and the results the current design reliably produces. | An account of why the problem survived earlier fixes, not a description of the fixes. |
| Framing the problem | The situation read through more than one frame, with the frame that best explains the evidence chosen openly. | A political or symbolic reading offered where a structural one would have been easier and wrong. |
| Theory applied | The named models used, each credited to its originating publication, with the specific insight each produced. | A stated limit on each model, showing it was used as a tool rather than recited. |
| Drivers and change ideas | A measurable aim, its primary and secondary drivers, and the changes proposed under each. | Every proposal traceable to a driver, and every driver traceable to the aim. |
| Measurement plan | Outcome, process and balancing measures, with owners, sources and reporting intervals. | A balancing measure that names a real cost, and intervals fast enough to steer by. |
| Adoption and references | Capacity, coupling, likely resistance and its remedy, with current APA throughout. | Resistance analyzed as a design fault rather than attributed to attitudes. |
Developing the synthesis
The literature this course draws on disagrees productively, and saying so is worth more than reconciling it. Systems thinking in the tradition of Peter Senge's The Fifth Discipline, published in 1990, asks leaders to see structures rather than events and holds that lasting change comes from altering those structures. Improvement science accepts that premise and then complains that it produces very little testable action, which is why it insists on small fast cycles and visible measurement. Richard Elmore adds a third position, that neither will matter unless the instructional core, meaning what teachers and students actually do with content, is the thing being changed. A synthesis paragraph puts those three in the same room: it argues that structural work without tested cycles becomes reorganization, that cycles without structural work optimize a broken arrangement, and that both are decoration unless the change reaches the classroom. Then it says which of the three your own organization is short of, and cites the evidence in your setting that made you decide.
Citations that survive faculty review
Attribution discipline matters more in this course than in most, because the frameworks are so widely repeated that students meet them secondhand and cite whoever repeated them. Go to the originating text every time: Argyris and Schön in 1978 for the two loops, Weick in 1976 for loose coupling, Senge in 1990 for the disciplines, Heifetz in 1994 for adaptive work, Kotter in 1996 for the eight steps, Bryk and colleagues in 2015 for improvement science, and Coburn in 2003 for the four dimensions of scale. Around those, use peer-reviewed empirical work from Educational Administration Quarterly, the American Educational Research Journal and Educational Evaluation and Policy Analysis for anything you claim about outcomes. Standards language should come from the Professional Standards for Educational Leaders rather than from a district handbook, and your own organization's documents can be cited as evidence provided you name them and say what they are. Reference in the seventh edition of the APA manual, and check that no framework in your text is credited to a citation published decades after the idea appeared.
The mistakes that land Basic instead of Distinguished
- Narrating an initiative instead of diagnosing a system. A timeline of what the district did answers no criterion about why the result persists.
- Recommendations with no measures attached. A proposal that cannot be evaluated is an opinion, and the evaluation criterion will score it as one.
- Treating adaptive work as a communication problem. If the fix requires people to give up something they value, no rollout plan will substitute for that conversation.
- One frame applied without acknowledgement. Structural answers to political problems produce reorganizations that change nothing and read as inexperience.
- Scale defined as headcount. Reaching more buildings while the depth of practice stays unchanged is spread without improvement, and the literature has said so since 2003.
EDD FPX 8020 questions students actually ask
How is improvement science different from a school improvement plan?
A school improvement plan commits to actions and reports on them at the end of a year. Improvement science commits to a measured aim and treats each action as a test that could fail early and cheaply. The practical differences are three. The plan names activities, while the improvement approach names an outcome with a number and a date and works backward to the drivers that could move it. The plan reviews annually, while the improvement approach reads data at whatever interval lets you tell signal from noise. And the plan assumes the idea was right if it was implemented faithfully, while a test cycle treats a faithful implementation that changed nothing as useful information about the theory. Write your analysis in the second register and the criteria have somewhere to award the top level.
How do I write about resistance without blaming teachers?
Treat resistance as data about the change rather than a defect in the people. Most of what gets labeled resistance turns out on inspection to be one of four things: the change cost time nobody was given, it conflicted with a measure staff are still judged on, it arrived without the skill required to do it well, or it had failed here before and no one explained what would be different. Each of those has a design remedy and none of them is a motivation problem. Name which one you are looking at, cite the evidence that told you, and propose the corresponding fix. That paragraph reads as leadership, while a paragraph about mindsets reads as a complaint with references attached.
How long does a change have to run before I can say it worked?
Long enough to distinguish a shift from ordinary variation, which is a question about your data rather than about the calendar. On a run chart, the standard signals are a shift of eight or more consecutive points on one side of the baseline median, a trend of six or more points moving steadily in one direction, and a point far outside the pattern the chart has established. Weekly attendance data will reach eight points in two months, while a measure you can only collect each quarter will take two years to say anything at all, which is an argument for choosing a faster process measure to steer by. Say which signal you are waiting for and how long it will take to arrive, and a limitations paragraph writes itself.
Improvement analysis due?
Send the prompt, the criteria, and the initiative you are stuck describing. The first premium sample is free, and the diagnosis inside it belongs to your system.