Send the dataset or the transcripts with your guide and a premium original sample returns inside 24 to 48 hours: findings reported in the order the questions were asked, effect sizes and intervals beside every test, and revisions free until the criteria clear. The identity: DB FPX 9803, Project Results, 3 program points, the third course of the doctoral project sequence every DBA specialization runs through, inside the 45 point standard sequence of Capella's FlexPath DBA. In Capella's catalog the course code is written DB-FPX9803.
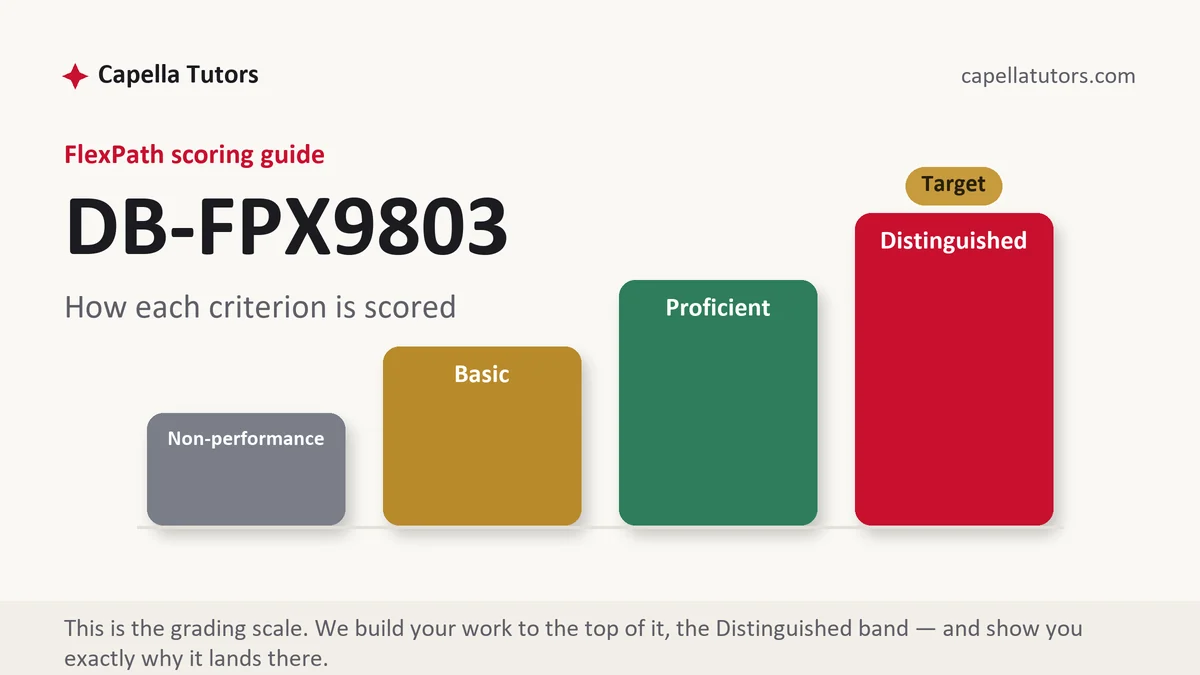
What DB FPX 9803 actually grades
This course grades restraint, which is why it surprises people who wrote a strong proposal. A results chapter reports what happened and stops. The order is fixed by your own questions: account for the sample first, describe the variables, show the checks the analysis depended on, then answer question one, then question two, each finding stated in a single sentence a reader could quote. Argument belongs in the discussion, and a results section that starts explaining why a coefficient is small has already lost the criterion that separates reporting from advocacy.
Numbers are graded on completeness rather than size. A p value alone is not a finding, because it tells a reader that something is unlikely to be noise without saying how much of anything there is. Every test carries an effect size and, where the analysis supports one, a confidence interval, and every percentage carries the denominator it came from and the window it covers. The doctoral move on top of that is translation: statistical significance belongs to the sample, practical significance belongs to the business, and a difference that is real and worth nothing has to be described as both.
Interview work is graded on evidence rather than eloquence. A theme needs a count of the participants who carried it, quotations chosen because they do something no paraphrase can do, and the case that disagreed reported rather than smoothed away. Absent results count as results in both traditions. A hypothesis that did not hold, or a theme that failed to appear where the literature predicted it, is a finding, and reporting it cleanly is worth more than the tidy story a sponsor hoped for.
How we help in this course
Send the file, the codebook or the transcripts and the guide, and the sample comes back with the reporting already assembled: participation accounted for line by line, assumption checks written up in prose rather than dumped as output, one table per question, and the finding sentence sitting under each table so a reader never has to infer it. Where the analysis has to change because the data will not support the original plan, we say so in the text and name the alternative test rather than quietly substituting one.
The rest is studio standard. A premium original deliverable inside 24 to 48 hours, written to the Distinguished descriptors of the guide you send, and an eight person pipeline that includes a reader whose sole task is checking that every figure in the prose matches the figure in the table it came from. Revision is unlimited and unbilled until the criteria clear, and chair comments re-enter the queue at no charge.
The assessments, one by one
Assessment 1
Assessment 1 of DB FPX 9803, Project Results, usually asks for the part of the results chapter that must exist before any finding does: every invitation and response accounted for, the variables described, reliabilities computed on this sample, and the checks the analysis depends on reported with their consequences. Read the full Assessment 1 manual.
Assessment 2
Assessment 2 of DB FPX 9803, Project Results, usually asks for the findings themselves: one subsection per research question, answered in the order the questions were asked, each test reported with its effect size and interval, and each result translated once into the language a decision maker uses. Read the full Assessment 2 manual.
Assessment 3
Assessment 3 of DB FPX 9803, Project Results, usually asks for the interview half of the chapter: themes defined rather than labelled, source counts given as fractions of participants, quotations chosen because a paraphrase would lose something, and the participants who disagreed reported in their own right. Read the full Assessment 3 manual.
How to actually write DB FPX 9803: where to begin
Account for the participants before you analyze anything. Say 412 employees received the invitation, 147 opened the survey and 128 finished enough of it to use, once 19 partial responses were dropped under the rule you declared in DB FPX 9802. That is a usable rate of 31 percent, and it is stated as a fraction rather than as a compliment. Then test whether the people who answered look like the people who did not: if 62 percent of your respondents sit in operations while operations is 48 percent of the workforce, the sample tilts, you say so, and you carry that tilt into every claim that follows.
Then report each model in full and translate it once. A regression of intent to stay on perceived supervisor support might return an unstandardized coefficient of 0.31 with a standard error of 0.09, a p value of .001, a 95 percent interval running from 0.13 to 0.49, and a model explaining 22 percent of the variance. Written that way a reader judges precision, magnitude and fit in one pass. The translation belongs beside it, in the language a committee uses: moving voluntary turnover from 22 percent to 18 percent in a 340 person operation avoids about 13.6 separations a year, and at a replacement cost near 40 percent of a $58,000 salary that is roughly $316,000 the organization stops spending. Then add the sentence that keeps the chapter honest, because a cross sectional survey supports association rather than cause.
Then handle qualitative findings with the same arithmetic discipline. Fourteen interviews that produce a theme carried by eleven participants is reported as eleven of fourteen, not as most participants, and the three who described the opposite get a paragraph rather than a footnote. Give each theme a definition, the number of sources behind it, and one or two quotations that carry information the summary cannot. Where a theme rests on a single articulate participant, say that too, since a theme with one voice is a hypothesis.
Then plan for the result that refuses to appear. When a test comes back non significant, report the estimate anyway with its interval, because an effect of 0.04 with an interval from minus 0.10 to 0.18 says something quite precise about how small the relationship can be, while the same estimate with an interval from minus 0.55 to 0.63 says only that the study was too small to see anything. Compare the sample you achieved with the one your power analysis required, because finishing with 96 usable responses against the 84 the plan called for means a shortfall is not available as an excuse. Then write what the organization should do given the uncertainty.
| Section | What goes in it | What Distinguished looks like |
|---|---|---|
| Sample and participation | Invitations, responses, exclusions under the stated rule, and the usable total. | Every case accounted for, with a comparison of respondents against the population they came from. |
| Descriptive results | Means, distributions, scale reliabilities computed on this sample, and the variable list. | Descriptives that flag the oddity a reader would notice, rather than a wall of default output. |
| Checks before testing | Assumptions examined, breaches named, and the remedy or the alternative test chosen. | Checks reported in prose with the consequence stated, including the tests abandoned and why. |
| Findings by question | One subsection per research question, with the analysis and the answer. | Test statistic, effect size, interval and a one sentence finding, in the order the questions were asked. |
| Qualitative evidence | Themes defined, source counts, illustrative quotations, and disconfirming cases. | Counts given as fractions of participants, with the contrary case reported in its own right. |
| Boundary and references | What the data cannot say, and current APA statistical reporting throughout. | The limits stated before the discussion asks for them, with every figure traceable to a table. |
Developing the analysis
Comparison to prior work is where a results chapter becomes doctoral, and where most drafts settle for the phrase consistent with the literature. Consistency has a direction and a magnitude. If published estimates of the association you tested cluster near .35 and yours came in at .18, the interesting sentence is about why, and the candidates are concrete: a narrower range on your measure, a single organization rather than many, a sample drawn during a restructuring, a scale shortened for length. Name the likeliest one and say what evidence would settle it.
Write for the reader the degree assumes, an executive rather than a methods examiner. That reader needs to know what changed, how confident anyone can be, and what acting costs, so a chapter answering those three questions with numbers beats one reproducing every table the software offered. Where a finding invites a causal reading, say plainly which study would earn it.
Citations that survive faculty review
Results chapters cite less than proposals and get audited harder. Statistical reporting follows current APA to the letter, which means the statistic, its degrees of freedom, an exact p value and an effect size in every sentence that reports a test. Reliability computed on your own sample is reported as yours and cited to the scale developer, so a reader can see whether your alpha behaved as its author reported.
Any benchmark you compare against needs a source and a year. Separation and tenure rates come from the Bureau of Labor Statistics rather than from a vendor blog, industry comparisons come from a named association survey with its sample described, and internal figures are attributed to the report they came from with its date. Cite prior studies by their effect sizes rather than their conclusions, since two papers agreeing in direction while disagreeing in magnitude is the point worth making.
The mistakes that land Basic instead of Distinguished
- Arguing inside the results. Explanation before the discussion tells a reader the findings needed help.
- A p value with nothing beside it. Significance without an effect size hides how small the difference might be.
- Percentages with no denominator. Sixty two percent of what, across which weeks, is the first question a reader asks.
- Causal verbs on correlational data. Drove, improved and increased are promises your design cannot keep.
- The inconvenient finding left out. A reviewer who finds it in your tables and not in your text stops trusting the rest.
DB FPX 9803 questions students actually ask
Nothing came out significant. Does the project fail?
No, and the chapter often gets stronger. What fails is a null result reported as an apology. Give the estimate, its interval and its effect size, compare the sample you achieved with the one the plan required, and interpret the width of the interval rather than the verdict of the test, because a tight interval around zero is a real finding about how little room the relationship has. Then say what the organization should do with that. A recommendation not to fund a program on the evidence available is a legitimate contribution to practice, and reviewers accept it far more readily than a marginal result inflated into a mandate.
How much data belongs in the chapter and how much in the appendix?
The chapter carries what a reader needs to follow the argument, and the appendix carries what a skeptic needs to check it. In practice that means one table per research question in the text, with descriptives and reliabilities in a single early table, and full output, extended coding schemes, item level frequencies and any long transcript excerpts moved to appendices. Never present the same numbers twice in two formats. If a table earns its place, the prose beside it should say what the table means rather than reciting its cells, and if the prose can carry the finding in two sentences, delete the table.
What if the finding embarrasses the organization that let me in?
Report it, and control the frame rather than the content. Confidentiality was the promise, not favorable results, and the protections you built do most of the work: the site described by sector and size rather than by name, individuals by role only where the role does not identify them. Write the finding in the flattest language available, put it beside the base rates and the limitations, and pair it with a recommendation the organization could actually act on. A sponsor is far more likely to accept an unwelcome result that arrives with a costed next step than one delivered as a verdict.
Results chapter waiting on you?
Send the data, the codebook and the guide. The first premium sample is free and the finding sentences come written.