This manual is for DB FPX 9803 Assessment 1, start to submission. Assessment 1 of DB FPX 9803, Project Results, usually asks for the part of the results chapter that must exist before any finding does: every invitation and response accounted for, the variables described, reliabilities computed on this sample, and the checks the analysis depends on reported with their consequences. Your scoring guide names the criteria, and restraint is what all of them reward. What follows is the order our tutors work in, a structure keyed to the criteria, and an annotated excerpt. Prefer this written for you? A premium original sample of this deliverable returns inside 24 to 48 hours and is revised free until the criteria are met. Capella's catalog lists the course as DB-FPX9803, and some courserooms print DB9803; both point to this same Assessment 1.
One honesty note before the manual: Capella revises courses and scoring guides over time, so always write to the exact scoring guide attached to your assessment in the courseroom. The course identity above is verified on capella.edu; the method and structure below are our tutors' approach to it, not Capella's official rubric text.
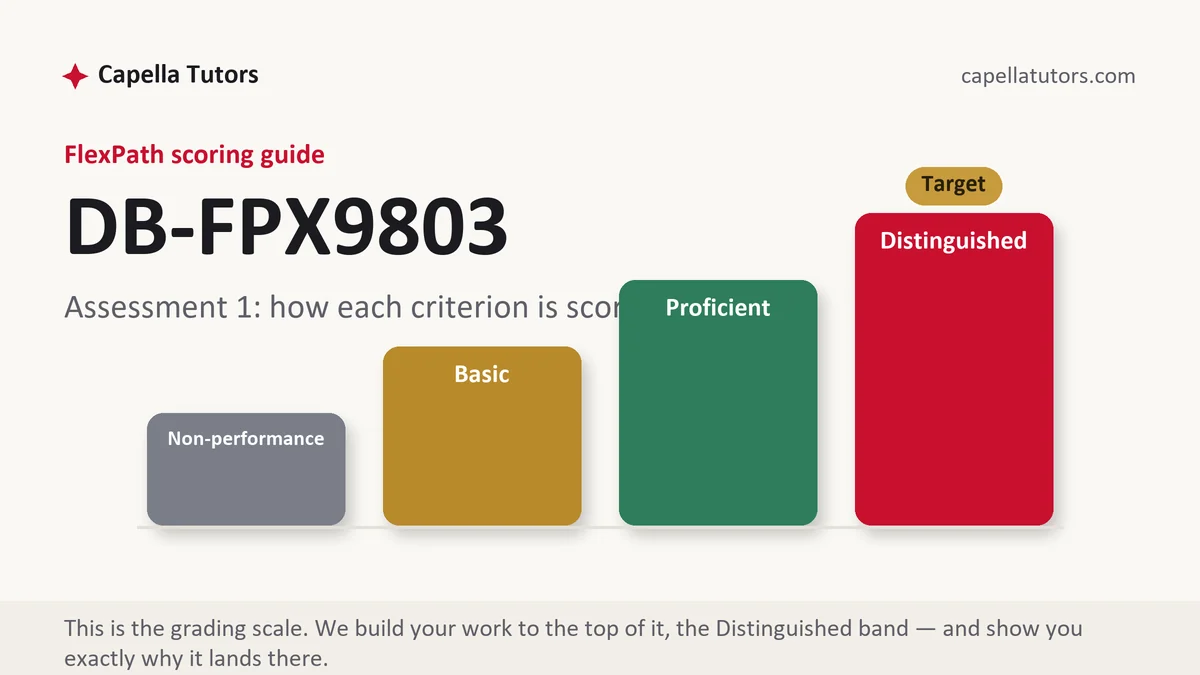
How DB FPX 9803 Assessment 1 is scored
There are no letter grades in FlexPath. Each criterion on the scoring guide lands on one of four levels, and the level language is the writing brief:
| Level | What it means on a sample and descriptives submission |
|---|---|
| Distinguished | Every case is accounted for from invitation to usable response, respondents are compared against the population they came from, and the checks are reported in prose with the consequence named. The extra move is flagging the oddity a reader would have found. |
| Proficient | Participation, descriptives and checks are all reported accurately. Complete, and still a wall of output where the guide wants a reader guided. |
| Basic | A response rate with no arithmetic behind it, default software tables reproduced in full, and checks described as satisfactory. |
| Non-performance | A required element is absent, most often the accounting for excluded cases, or descriptives for variables the analysis later uses. |
Two habits here decide how the rest of the chapter reads. Account for every case before analyzing any of them, because a reader who cannot reconstruct how 231 invitations became 74 usable responses has no way to weigh what follows. Then resist explanation, since this section reports, and the moment it starts arguing why a distribution is skewed it has taken work from the discussion and lost the criterion that separates reporting from advocacy. Any tilt you find in the respondents also has to be carried forward by name into the findings, because a sample leaning toward two plants limits every claim made after it.
The DB FPX 9803 Assessment 1 method, step by step
-
Account for the cases before anything else
State how many were invited, how many started, how many finished enough to use, and how many were excluded under the rule you declared before collection. Give the usable figure as a fraction rather than as a compliment, and make the arithmetic reconstructable from the sentence alone.
-
Test the respondents against the population
Compare the people who answered with the people who did not on the attributes that could move a finding: site, function, tenure, grade. Where the composition tilts, name the tilt with numbers, because a reviewer runs this comparison whether or not you do.
-
Describe the variables a reader will need
Means, standard deviations, ranges and distribution shape for every variable the analysis uses, including the covariates. Point at the feature a careful reader would notice, and say which statistic the later argument should rest on without yet arguing anything.
-
Compute reliability on your own sample
Report the figure your data produced beside the item count and beside what the scale developer reported, so a reader can see whether the instrument behaved here as its author described. A scale that came apart in your setting is a finding worth its own sentence.
-
Report the checks and their consequences
Every condition the planned analysis depends on, examined and reported in prose, with what you did about any breach. Name the tests you abandoned and why, since a check that changed the plan is more informative than a list of checks that all passed.
-
Strip the arguing out of the section
Read every sentence hunting for because, suggests, indicates and likely, and delete them. Then self-score each criterion at Distinguished, Proficient, Basic or Non-performance, and submit early in the week, since faculty have two business days to evaluate an attempt.
A structure that maps to the criteria
These lengths are our tutors' planning figures for a participation and descriptives submission, not Capella rules; the criteria in your guide decide the real proportions.
| Section | What it must do | Guide |
|---|---|---|
| Sample and participation | Invitations, responses, exclusions applied under the declared rule, and the usable total as a fraction. | ~300 words |
| Respondents against the population | How the people who answered compare with those who did not, on the attributes that matter. | ~250 words |
| Descriptive results | Means, standard deviations, ranges and distribution shape for every variable the analysis uses. | ~350 words |
| Measurement reliability | Reliability computed on this sample, beside the item count and the developer's reported figure. | ~200 words |
| Checks before testing | Each condition examined, what it showed, the remedy chosen, and any test abandoned with its reason. | ~350 words |
| Tables and references | One table per idea, current APA statistical reporting, every figure in the prose traceable to a table. | as needed |
Annotated sample excerpt
An original model excerpt from our team, written on a manufacturing procurement scenario, showing how participation and descriptives are reported without argument. Learn the sequence, then run it on your own file.
Invitations went to all 231 buyers, category managers and planners across the six plants; 88 opened the instrument and 74 supplied enough of it to use once 14 responses were removed under the completeness rule declared before collection, a usable rate of 32.0 percent.1 The respondents are not a scale model of the population: 58 percent sit at the two plants that account for 41 percent of indirect spend, and planners appear at roughly twice their share of the workforce.2 Cycle time is reported in calendar days from requisition approval to executed contract, with a mean of 34.6 days, a standard deviation of 19.2, a median of 29 and a maximum of 118, so the distribution is right skewed and the median is the figure later sections should carry.3
- 1Every case is traceable from invitation to usable response, and the exclusion is defended by a rule that existed before the data did.
- 2Names the tilt with numbers instead of calling the sample broadly representative, which is the claim a reviewer checks first.
- 3Descriptives that flag the shape a reader would notice and say which statistic later work should rest on, without arguing anything yet.
The full premium sample for your exact assessment, written fresh to your scoring guide and setting, is free to request. Study it, revise it into your own voice, and submit work you understand.
The five mistakes that cost Distinguished
- A response rate with no arithmetic. Roughly a third responded leaves a reader unable to reconstruct one of your denominators.
- Excluded cases that vanish. Fourteen removed responses have to appear somewhere, or a reader assumes they were removed for being inconvenient.
- Default output reproduced in full. Every table the software offered is not a chapter, and the criterion rewards the tables a reader needs.
- Explanation smuggled into the descriptives. The moment you write that the skew is probably because, the discussion has lost its job and you have lost the criterion.
- A sample described as representative. Representative is a claim, and usually one your own composition table can refute.
Pre-submission checklist
- Every case traced from invitation to usable response, with exclusions applied under a rule declared in advance
- Respondents compared against the population on the attributes that could move a finding
- Means, standard deviations, ranges and distribution shape given for every variable the analysis uses
- Reliability computed on this sample and reported beside the item count and the developer's figure
- Each condition examined, its result stated, and any abandoned test named with its reason
- No sentence in the section explains a number, and every figure in the prose appears in a table
Data in hand and the chapter will not start?
Send the file, the codebook and the guide. Inside 24 to 48 hours a premium original sample returns with participation accounted for line by line, the composition comparison built, the checks written in prose rather than dumped as output, and one table per idea. A reader on the pipeline checks nothing except that every figure in the text matches the table it came from, and revisions are unlimited until the criteria clear.