Send the prompt and the scoring guide for whatever this course asks you to produce, and a premium original sample comes back inside 24 to 48 hours, aimed at the Distinguished descriptors, with every calculation rechecked by a second reader. On a transcript the course reads BUS FPX 3022, Fundamentals of Supply Chain Management, worth 1.5 program points, a core course in the BS in Business, delivered in FlexPath, and one of the upper-division courses that fills the minimum of 27 points at the 3000 level or above inside the 90-point degree. In Capella's catalog the course code is written BUS-FPX3022.
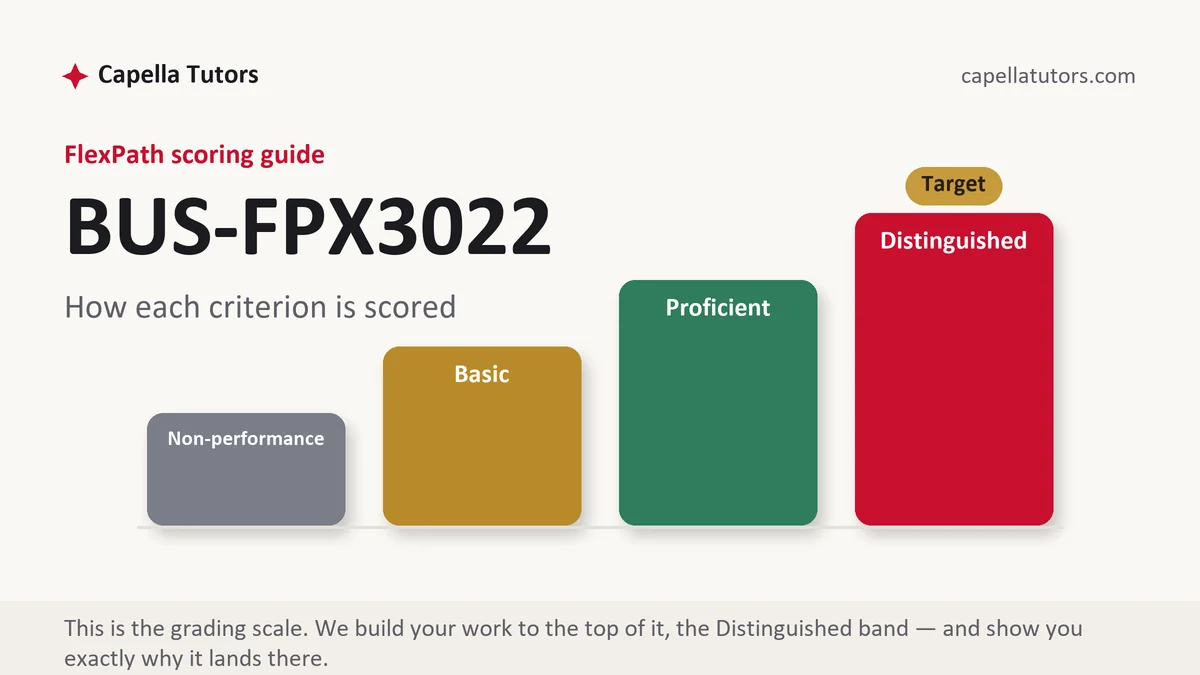
What BUS FPX 3022 actually grades
A supply chain course at this level stops drawing boxes and starts pricing the arrows between them. In current courserooms the assessments include "SCM Case Analysis: Forecasting and Planning" and "SCM Case Analysis: Information Technology" among others, and your scoring guide decides the exact format of each. The criteria then grade one thing hardest: whether your recommendation names the tradeoff it accepts. Faster delivery costs freight. A lower unit price costs lead time. Leaner inventory costs service. A Basic answer recommends improvement and stops there. An upper-division answer says what improves, what gets worse, and by how much, in dollars or days or fill rate.
Inventory is where the arithmetic starts, because it is the one place a student can compute a company's behavior from published figures. Turns are cost of goods sold divided by average inventory, so a distributor reporting 4.8 million dollars of cost of goods sold against 800,000 dollars of average inventory is turning six times a year, which is 61 days of supply once you divide 365 by six. A competitor turning nine times carries about 533,000 dollars to support the same sales volume. That 267,000 dollar difference is not idle money on a shelf, since at a carrying rate of 22 percent for capital, space, insurance, obsolescence, and handling it costs roughly 58,700 dollars a year to hold. Writing that chain of four steps, ratio to days to dollars to carrying cost, shows a grader you can operate the concept rather than define it.
Sourcing is graded the same way, and unit price is the trap. An offshore supplier quoting 6.40 dollars a unit against a domestic quote of 7.15 dollars looks like an easy 75 cent win until the rest of the line is filled in: freight and drayage per unit, duty, inspection, and six or seven weeks of goods in transit that have to be financed and then duplicated as safety stock at the receiving end. Total landed cost is the number a purchasing manager defends. On-time in-full, perfect order rate, and fill rate are ratios with a denominator you have to state, and a scorecard weighting price at 60 percent selects a different vendor than one weighting quality and delivery at 60 percent.
How we help in this course
Our 3022 drafts arrive with the numbers already run. If your assessment names a company, we pull its cost of goods sold and its inventory from the filings and compute the ratios rather than describing them, and if it hands you a scenario, we build the cost table from the figures in the prompt and flag any input the prompt left out. Tell us the organization and the scoring guide, and the analysis will be about your case rather than a textbook firm.
Delivery works the way it does everywhere else on this site. Each deliverable lands inside 24 to 48 hours, written to the top criterion column, and it passes through eight people on the way out: a research analyst pulls the sources and the filings, a business writer drafts, a scoring-guide reviewer grades the draft row by row the way your evaluator will, an APA and originality pass checks citations in both directions, and an editor reads last with a calculator open. Revisions stay free until the work meets the guide, and anything faculty send back re-enters the cycle at no cost.
The assessments, one by one
Assessment 1
Analyze a company's direct-to-consumer distribution as a supply chain strategy, its advantages and disadvantages, and recommendations for improving it. Read the full Assessment 1 manual.
Assessment 2: SCM Case Analysis: Forecasting and Planning
Forecasting and Planning: compare the supply chain models of two companies, their transportation strategies, risks and mitigation, economic and political factors. Read the full Assessment 2 manual.
Assessment 3: SCM Case Analysis: Information Technology
Information Technology: analyze how a company uses information systems and automation in its supply chain, the effects on customers and sales, competition. Read the full Assessment 3 manual.
How to actually write BUS FPX 3022: where to begin
Open the scoring guide before you open the case. Turn each criterion into a heading, paste the Distinguished sentence underneath it while you draft, and refuse to write a paragraph that does not sit under one of those headings. The criteria here usually cluster in a predictable order: describe the chain end to end, analyze one decision inside it with numbers, evaluate a supplier or a logistics option against stated measures, then recommend a change and say what it costs and what it risks.
The calculation that most reliably separates the columns here is a break-even on a make-or-buy decision, and it takes four lines. Suppose a component is bought at 18.50 dollars a unit, and producing it in house would cost 12.20 dollars a unit in materials and labor plus 340,000 dollars of tooling that does not vary with volume. The saving per unit is 6.30 dollars, so the tooling pays for itself at 340,000 divided by 6.30, which is about 53,970 units a year. The recommendation now writes itself in either direction: at a forecast of 42,000 units, buying is cheaper by roughly 75,400 dollars a year, while at 70,000 units the in-house option saves about 101,000 dollars. If the forecast is soft by 15 percent, does the answer flip, and at what volume would you revisit it? A break-even quantity followed by a sensitivity check settles the column question on its own.
Close with risk, because supply chain criteria almost always carry a resilience row and most drafts leave it as a sentence about uncertainty. Say where the chain has a single point of failure, what the exposure is worth, and what removing it costs. A second source costs a known amount in audit time, duplicated tooling, and lost volume discount, set against an outage whose probability you cannot pin down but whose cost per week of stopped production you can. Naming the figure you cannot compute, and saying why, reads as judgment rather than as a gap.
| Section | What goes in it | What Distinguished looks like |
|---|---|---|
| The chain described | The organization's nodes and flows from supplier tier through the customer, with the product family named. | A scope narrow enough to analyze, with the boundary of the study stated and defended. |
| Demand and inventory position | Volume, seasonality, current turns or days of supply, and the service level the business holds to. | Ratios computed from stated inputs, with every figure sourced or openly declared an estimate. |
| The costed decision | The sourcing, inventory, or transportation choice under review, with unit economics and total landed cost. | A break-even or cost comparison a reader can reproduce from the numbers on the page. |
| Supplier or carrier evaluation | Criteria, weights, and scores, with delivery and quality measured rather than asserted. | Weights justified against the buying firm's strategy instead of copied from an example. |
| Risk and resilience | Single points of failure, lead-time exposure, and the cost of the mitigation being proposed. | Exposure quantified where the data allows and openly bounded where it does not. |
| Recommendation and references | The change, its cost, its timing, the measure that will track it, and current APA both ways. | A monitoring measure the firm already reports, on a named review cycle. |
Developing the analysis
The operations literature does not agree with itself, and saying so is worth a criterion. Decades of research and practice pushed inventory down, consolidated suppliers, and treated buffer stock as waste. The disruption research that followed pushed the other way, arguing that concentrated sourcing and thin buffers turn an ordinary shock into a stoppage. Both bodies of work rest largely on case studies and industry surveys rather than controlled comparison, which earns a sentence of skepticism, because a case study of a firm that survived tells you nothing about the firms with the same policy that did not. Say which risk this firm can afford, given its margin and how easily its customers could buy elsewhere, then hold that position through the recommendation. The bullwhip effect deserves equal care: cite the researchers who demonstrated the amplification rather than a consultancy page, and explain the mechanism, since order batching and price promotions produce it and better forecasting alone will not remove it.
Citations that survive faculty review
Three kinds of source carry a supply chain paper. Peer-reviewed operations research, retrieved through the Capella library in Business Source Complete and ABI/INFORM, supports every general claim about what a practice does. Company primary documents carry your figures, and for a public firm that means the annual report and the 10-K rather than a summary site, since inventory, cost of goods sold, and segment volumes are disclosed there and a grader can check them. Professional bodies supply the definitions that keep your terminology honest, principally ASCM and APICS reference material and the Council of Supply Chain Management Professionals, because fill rate and perfect order have settled definitions that students improvise around. One reading habit raises accuracy quickly: when a source reports a saving as a percentage, find the base before you quote it, because a 30 percent cut in freight spend and a 30 percent cut in total logistics cost differ by an order of magnitude. State the denominator and the window before any rate you publish, then run the citation check both ways.
The mistakes that land Basic instead of Distinguished
- Recommending a change with no cost attached. A supply chain proposal without a number is an opinion, and the criteria catch it.
- Comparing unit prices instead of landed costs. Freight, duty, inspection, and pipeline inventory settle more sourcing questions than the quoted price.
- Ratios published with no denominator. Fill rate on lines, on orders, and on units gives three answers from one month.
- Treating a forecast as a fact. Volume drives every calculation here, which is why the sensitivity test is not optional.
- Definitions borrowed from a consulting blog. Terminology here is standardized, and a grader who checks finds the improvisation.
BUS FPX 3022 questions students actually ask
The company I picked does not publish supply chain data. What now?
Derive what you can and label the rest. A public company's annual report gives you inventory on the balance sheet and cost of goods sold on the income statement, which is all you need for turns and days of supply, and the management discussion usually describes sourcing regions, distribution centers, and any concentration risk the firm must disclose. Put your constructed inputs in a short assumptions table so a reader can argue with one specific number rather than with the whole paper.
How much arithmetic does a business core course actually expect?
Arithmetic, not modeling. Nothing here requires optimization software or a statistics package, and a spreadsheet with visible formulas is enough. What the criteria want is that every number appears with its inputs, its calculation, and its interpretation, in that order, so a reader can reproduce it. Show the formula, show the substitution, give the result with its unit, then say what the result means for the decision. That closing sentence is the one students skip, and it is usually the one being graded, because a turns ratio with no comment attached proves you can divide and nothing else.
Should I use my employer or a public company for the analysis?
Use whichever gives you numbers you are allowed to publish. An employer gives you detail no filing contains, including real lead times and actual stockouts, and it is the better choice if you can deidentify the firm and keep supplier pricing out of the document. A public company gives you auditable figures a grader can verify. What does not work is a well-known brand analyzed entirely from news coverage, since you end up with adjectives where the criteria want ratios.
Sourcing analysis due?
Send the prompt, the criteria, and whatever figures the case gave you. We will build the cost comparison and show every step of it. First sample comes at no cost.