Upload the prompt, the scoring guide, and any data your instructor attached, and a premium original sample comes back in 24 to 48 hours with every calculation shown and every curve movement explained in words as well as on the diagram. In the catalog it is BUS FPX 1050, Principles of Microeconomics, carrying 3 program points as one of the Social Science options you may choose to satisfy general education in the BS in Business, offered in FlexPath within a 90-point degree that reserves 27 or more of those points for work at the 3000 level and above. In Capella's catalog the course code is written BUS-FPX1050.
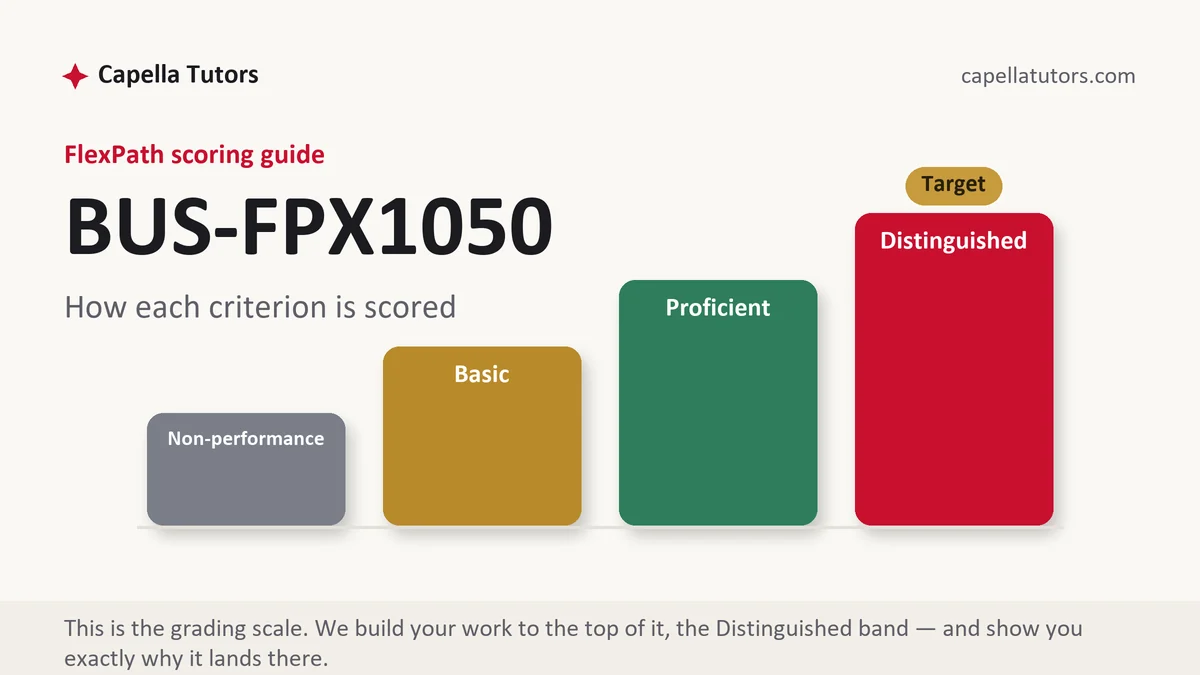
What BUS FPX 1050 actually grades
Microeconomics grades one skill in several costumes: whether you can move between a story, a diagram, and a number without the argument changing along the way. The assessments in this course usually describe something happening in a market and ask what follows for price and quantity, and the criteria separate the mechanism from the conclusion. Saying that prices will rise is the conclusion, and on its own it earns the Basic column even when it is correct. Saying which curve moved, in which direction, because of which determinant, and what that did to equilibrium quantity as well as to price is the analysis the top column describes.
The distinction that decides more rows here than any other is a shift against a movement. A change in the price of the good itself never moves the demand curve, it moves you along it, and writing that demand fell when buyers purchased less at a higher price is the fastest way to lose a criterion. Demand moves when something other than that price changes: income, the price of a substitute or a complement, tastes, expectations, or the number of buyers. Supply moves for input prices, technology, the number of sellers, expectations, and taxes or subsidies. A frost in a growing region shifts supply left and produces a higher price with a lower quantity traded. A rise in household income for a normal good shifts demand right and produces a higher price with a higher quantity. Two stories, two opposite quantity results, and the quantity is the thing that proves to an evaluator you knew which curve you touched.
Beyond the two curves, the course grades arithmetic and structure. Price elasticity of demand is the percentage change in quantity divided by the percentage change in price, and its size tells you what happens to revenue. Take a shop that lifts a drink from $4.00 to $4.40 and watches weekly sales fall from 900 units to 780. That is a 10 percent price increase against a 13.3 percent quantity decline, an elasticity near 1.33, and revenue moving from $3,600 to $3,432. Demand was elastic, so the price rise cost money, and putting those figures on the page is worth more than a paragraph about consumer sensitivity. Market structure is the other half. Perfect competition, monopolistic competition, oligopoly, and monopoly differ by the number of sellers, how alike the products are, and how easily a new firm can enter, and every one of them maximizes profit where marginal revenue equals marginal cost.
How we help in this course
Our 1050 samples show the working. Every elasticity is computed on the page with the formula named, every diagram is described in the prose so the explanation row can be graded on its own, and every claim about a market is tied to a determinant rather than to a general sense that conditions changed. If your assessment supplies a table of prices and quantities, the sample uses your numbers, and the totals in the narrative match the totals in the table.
The surrounding terms are the ones we quote on every course. Turnaround is 24 to 48 hours, the target is the Distinguished column, and eight people touch the file before you do: a research analyst collects your scoring guide and the data series the prompt implies, a subject writer builds the argument and the calculations, a scoring-guide reviewer marks it criterion by criterion in the way an evaluator would, an APA and originality pass checks the citations and the reference list against each other, and an editor reads for clarity at the end. One of those reads is spent purely on whether every number in the document agrees with every other number. Revisions cost nothing until the guide is met, and returned faculty comments go through the same cycle without further charge.
The assessments, one by one
Assessment 1
The opening deliverable in Principles of Microeconomics usually describes something happening in a market and asks what follows for price and quantity, so the graded object is the mechanism: which curve moved, in which direction, because of which determinant. Read the full Assessment 1 manual.
Assessment 2
The middle deliverable in Principles of Microeconomics usually hands you a price change and a pair of quantities and asks what it did to revenue, which means the arithmetic belongs in the body of the paper with the formula named beside it. Read the full Assessment 2 manual.
Assessment 3
The closing deliverable in Principles of Microeconomics usually asks you to classify a market by its structure and then trace what a policy does inside it, so the graded chain runs structure, prediction, quantified consequence, and who bears it. Read the full Assessment 3 manual.
How to actually write BUS FPX 1050: where to begin
Start from the scoring guide, and notice that economics rubrics usually split the diagram and the explanation into separate rows. A correct graph attached to a vague paragraph loses half the available marks, and an excellent paragraph beneath an unlabeled graph loses the other half. Turn each criterion into a heading, keep the figure and the sentences that interpret it under the same heading, and label both axes and name both curves every single time, including on a graph you are certain the reader will recognize.
Write every market claim in three moves: the assumption, the mechanism, and the effect on both variables. The assumption is usually that everything else is held constant, and saying so is not padding, it is what makes the prediction testable. The mechanism is the determinant that moved and the direction it pushed the curve. The effect has to name price and quantity separately, because the pair of them identifies which curve moved and lets a reader check you. A paragraph carrying all three is hard to score below Proficient even when the topic is simple.
Then handle time. Elasticity is not a fixed property of a good, it depends on how long buyers have had to react and on whether a substitute exists. Gasoline demand across one week is close to inelastic, because the trips are already committed, and across three years it is far less so, because vehicles get replaced and commutes get rearranged. An assessment that asks about a price change without naming a horizon is asking you to supply one. Name the horizon in the first sentence of the section and the rest of the paragraph will hold together.
| Section | What goes in it | What Distinguished looks like |
|---|---|---|
| The market | The good, the buyers, the sellers, and the geography or period being analyzed. | A market narrow enough that a curve can plausibly describe it, with the boundaries stated. |
| The change | The event, the determinant it acts on, and which curve moves in which direction. | The determinant named explicitly, with a movement along a curve ruled out in writing. |
| The diagram | Labeled axes, named curves, and the original and new equilibrium points marked. | A figure that could be read with the caption removed, matching the paragraph beside it. |
| The calculation | Elasticity, revenue, cost, or surplus computed with the formula stated and the units carried. | Working shown line by line, with the method named wherever more than one exists. |
| Policy or welfare | Any ceiling, floor, tax, subsidy, or externality, and who gains and who loses. | Shortage or surplus quantified, and the burden traced to the side that behaves less elastically. |
| Sources and format | Official data series and peer-reviewed economics, cited in current APA with retrieval details. | Series named precisely by title and period, with the textbook used only for definitions. |
Developing the analysis
Economists disagree about consequences far more than about mechanics, and an assessment that lets you show the disagreement is an assessment you can score well on. The minimum wage is the standard case. In the competitive model a wage floor set above the market-clearing wage produces unemployment, because the quantity of labor supplied exceeds the quantity demanded, and the prediction follows from the model before any data is collected. Introduce a labor market with few employers, where a single buyer of labor faces an upward-sloping supply curve, and the same floor can raise employment instead. Published studies have landed on both sides depending on the size of the increase, the local labor market, and the years examined. Rent control produces a similar split, with the shortage prediction of the basic model set against arguments about tenure security and housing quality. What the criteria reward is not a verdict. It is noticing that the prediction came out of a model, naming the assumption the model rests on, and saying what would have to be true in the market in front of you for the other result to appear.
Citations that survive faculty review
Data and theory carry different citation obligations in this course. Official statistical series are the backbone of any applied claim, so reach for Bureau of Labor Statistics releases, Census figures, Energy Information Administration data, or the FRED database, and cite them the way a reader could reproduce: the producing agency, the series or table title, the period the figure covers, and the date you retrieved it. Peer-reviewed economics, reached through the Capella library and EconLit or Business Source Complete, carries any claim about how a market actually responded, because that is a finding and findings need studies behind them. A textbook is a legitimate source for a definition or a standard model and for nothing else, and a reference list stacked with textbook entries is a signal faculty read at a glance. Two habits keep an applied section honest. Give every rate a denominator and a period, since a 12 percent increase means nothing without both, and never set a dollar figure from one year beside one from another without saying whether it has been adjusted for inflation and against which index.
The mistakes that land Basic instead of Distinguished
- Demand fell when quantity demanded fell. A price change moves you along the curve, and the wrong verb tells an evaluator the model is not in place.
- An unlabeled diagram. Axes and curves without names cannot be graded, and that row is usually scored apart from the prose.
- Elasticity with no method attached. The simple and midpoint formulas return different answers, so the number needs the formula printed beside it.
- Sunk costs treated as relevant. Money already spent cannot be recovered by the next decision, and including it inverts the recommendation.
- Dollars compared across years. Nominal figures from different periods are different units, and comparing them undermines everything built on top.
BUS FPX 1050 questions students actually ask
Do I have to draw the graphs myself?
If a criterion mentions a graph, yes, and the graph has to be yours rather than an image lifted from a website. Build it in a spreadsheet or a drawing tool, label the vertical axis as price with its units and the horizontal axis as quantity per period, name each curve, and mark both equilibrium points wherever a shift is involved. Then write the paragraph as though the figure were missing. That habit protects you twice, because the explanation row is usually scored on its own, and because a reader who cannot follow your figure can still follow your reasoning. Add a figure number and a short caption if your guide asks for formatted figures.
Which elasticity formula does the course want?
Your scoring guide decides, and where it stays silent the safe move is to name the method and show both when they differ meaningfully. The simple percentage change method divides the change by the starting value, so a move from $4.00 to $4.40 is a 10 percent rise. The midpoint method divides by the average of the two values, which returns about 9.5 percent for the same move and has the advantage of producing one figure whether the price rose or fell. Report elasticity as an absolute value unless the guide asks for the sign, say which formula produced it, and interpret it: above one is elastic, below one is inelastic, and at one revenue does not move.
Where do I find real numbers for a market I am writing about?
Start with the federal statistical agencies before anything else. The Bureau of Labor Statistics publishes prices, wages, and employment by industry and occupation, the Census Bureau publishes business and retail figures, the Energy Information Administration publishes fuel prices by region, and the FRED database gathers series from many of them in one place with clean citation details. Trade associations and industry reports fill the gaps for narrow markets, and company filings give quantities for a single firm. Whatever you use, name the geography and the period inside the sentence, because a national average applied to a local market is an error a reader can see from a distance.
Microeconomics assessment due?
Send the prompt, the scoring guide, and any data table you were given. Every calculation comes back with the formula shown. There is no charge for the opening premium sample.