This manual is for BUS FPX 1050 Assessment 1, start to submission. The opening deliverable in Principles of Microeconomics usually describes something happening in a market and asks what follows for price and quantity, so the graded object is the mechanism: which curve moved, in which direction, because of which determinant. Below is the method our tutors use for it, a structure that maps to the criteria, and an annotated sample excerpt. Want it handled instead? A premium original sample for this exact assessment comes back in 24 to 48 hours, revised free until it meets the guide. Capella's catalog lists the course as BUS-FPX1050, and some courserooms print BUS1050; both point to this same Assessment 1.
One honesty note before the manual: Capella revises courses and scoring guides over time, so always write to the exact scoring guide attached to your assessment in the courseroom. The course identity above is verified on capella.edu; the method and structure below are our tutors' approach to it, not Capella's official rubric text.
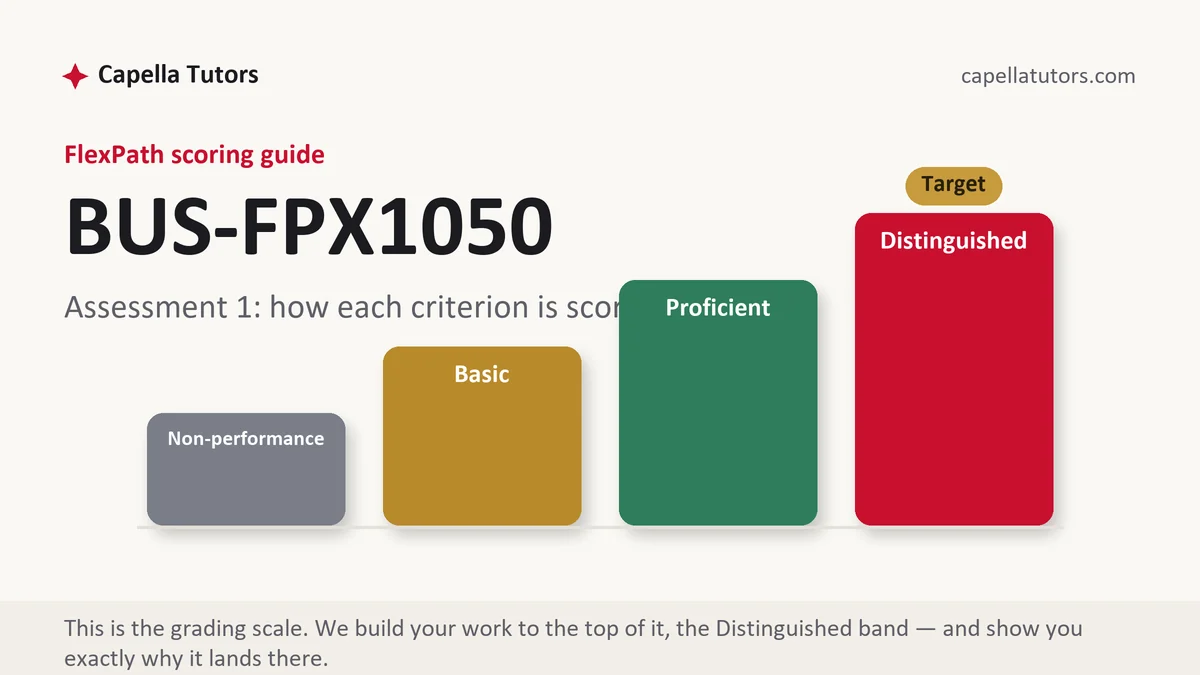
How BUS FPX 1050 Assessment 1 is scored
There are no letter grades in FlexPath. Each criterion on the scoring guide lands on one of four levels, and the level language is the writing brief:
| Level | What it means on a supply and demand analysis |
|---|---|
| Distinguished | The determinant is named, the curve and direction follow from it, and both equilibrium price and equilibrium quantity are stated. The paragraph also says what is being held constant, which is what makes the prediction checkable. |
| Proficient | The right curve moved for the right reason, with the effect on price given and the effect on quantity treated as an afterthought. |
| Basic | The conclusion is correct and the mechanism is missing. Prices will rise, with no account of which curve produced the rise, sits here even when it is true. |
| Non-performance | Demand described as falling when buyers simply bought less at a higher price. Confusing a shift with a movement along the curve reads as the model not being in place. |
Most economics rubrics score the diagram and the explanation as separate rows. A tidy graph under a vague paragraph loses half the marks available, and a sharp paragraph under an unlabeled graph loses the other half.
The BUS FPX 1050 Assessment 1 method, step by step
-
Split the criteria into diagram rows and explanation rows
Read the guide first and mark which rows are asking for a figure and which are asking for prose. Keep the figure and the sentences that interpret it under the same heading, so the evaluator never has to hunt across pages to score one row.
-
Define the market narrowly enough that a curve can describe it
Food is not a market. Single-serve ice cream sold from stalls at one city's weekend markets, in one summer, is a market, and its boundaries can be stated in a sentence. A market defined too broadly makes every prediction defensible and therefore unscorable.
-
Name the determinant before you touch a curve
Demand responds to buyer income, the price of a substitute or a complement, tastes, expectations, and how many buyers there are. Supply responds to what inputs cost, the technology available, how many firms are selling, expectations, and any tax or subsidy. Write the determinant, then the curve, then the direction, in that order every time.
-
Rule out a movement along the curve on the record
Add one sentence saying that the price of the good itself did not cause the shift, because that price is on the axis. It looks pedantic and it is the single cheapest sentence in the course, since a criterion is often written to test precisely this distinction.
-
Report both variables, then handle a second determinant separately
Every conclusion names price and quantity, because the pair identifies which curve moved. When two things change at once, work them one at a time and say which effect on quantity dominates, or say plainly that the direction of quantity is indeterminate without more information.
-
Label the figure as though the caption were missing, then self-score
Vertical axis price with its units, horizontal axis quantity per period, both curves named, and the original and new equilibrium points marked. Then grade each row yourself and submit early, allowing for the two business days an evaluation can take.
A structure that maps to the criteria
These lengths are planning targets our tutors use for an introductory market analysis, not Capella rules; expand any section your own scoring guide weights more heavily.
| Section | What it must do | Guide word target |
|---|---|---|
| The market defined | The good, the buyers, the sellers, the geography, and the period, with the boundary stated rather than implied. | ~175 words |
| Baseline equilibrium | Where price and quantity sat before the event, sourced from data or from a labeled assumption. | ~175 words |
| The event and the determinant | What happened, which determinant it acts on, which curve moves, in which direction, and what is held constant. | ~350 words |
| The new equilibrium | The effect on price and on quantity, with a movement along the curve explicitly ruled out. | ~250 words |
| The figure and its reading | A labeled diagram with both equilibria marked, plus prose that would stand alone if the figure vanished. | ~200 words |
| Sources and format | Official statistical series named by title and period, textbook used only for definitions, current APA both ways. | as needed |
Annotated sample excerpt
An original model excerpt from our team, showing the register that scores at the top of the guide. It is study material: learn the moves, then write your own version.
The market analyzed is single-serve ice cream sold by stall vendors at weekend markets in one metropolitan area, over the twelve weeks from June through August, where Kettle and Cone is one of roughly thirty sellers.1 Two determinants move in this period and they must be handled separately: a run of unusually hot weekends acts on tastes and shifts demand to the right, while a rise in the wholesale price of cream acts on input costs and shifts supply to the left.2 Taking the demand shift alone, with input costs held constant, equilibrium price rises and equilibrium quantity rises; adding the supply shift raises price further while pulling quantity back, so price unambiguously increases and the direction of quantity depends on which shift is larger, which the vendor's own weekly unit counts could settle.3
- 1Boundaries first: good, channel, geography, period, and rough number of sellers. A market this narrow can actually be drawn.
- 2Each event is attached to a named determinant and a curve before any conclusion appears. Handling them separately is what the criterion is testing.
- 3Both variables reported, the held-constant assumption stated, and an indeterminate result named as indeterminate rather than guessed. Saying what would settle it reads as command of the model.
The full premium sample for your exact assessment, written fresh to your scoring guide and issue, is free to request. Study it, revise it into your own voice, and submit work you understand.
The five mistakes that cost Distinguished
- Price named, quantity forgotten. Quantity is the variable that proves which curve you moved, so leaving it out removes your own evidence.
- Two determinants mashed into one paragraph. Simultaneous shifts have to be separated before they are combined, or the result is asserted rather than derived.
- A market too wide to draw. A curve for an entire industry cannot be checked, and everything built on it becomes unfalsifiable.
- Axes without units. Price and quantity per what, over what period, is the difference between a diagram and a doodle.
- No held-constant sentence. Without it the prediction is a forecast, and forecasts are not what the model is for.
Pre-submission checklist
- The market bounded by good, buyers, sellers, geography, and period
- Every shift traced to a named determinant, written in determinant, curve, direction order
- A movement along the curve ruled out in one explicit sentence
- Both equilibrium price and equilibrium quantity reported for every change
- Axes labeled with units, curves named, both equilibria marked, prose readable without the figure
- Data series cited by title and period in current APA, self-scored Distinguished on every row
Want this assessment done with backup?
Send the prompt, the scoring guide, and any data table your instructor attached. A team of eight returns a premium original sample with every curve movement explained in words as well as on the diagram, inside 24 to 48 hours, revised until it clears the guide.