This manual is for BUS FPX 1050 Assessment 3, start to submission. The closing deliverable in Principles of Microeconomics usually asks you to classify a market by its structure and then trace what a policy does inside it, so the graded chain runs structure, prediction, quantified consequence, and who bears it. Below is the method our tutors use for it, a structure that maps to the criteria, and an annotated sample excerpt. Would rather it were written for you? A premium original sample for this exact assessment comes back in 24 to 48 hours, revised free until it meets the guide. Capella's catalog lists the course as BUS-FPX1050, and some courserooms print BUS1050; both point to this same Assessment 3.
One honesty note before the manual: Capella revises courses and scoring guides over time, so always write to the exact scoring guide attached to your assessment in the courseroom. The course identity above is verified on capella.edu; the method and structure below are our tutors' approach to it, not Capella's official rubric text.
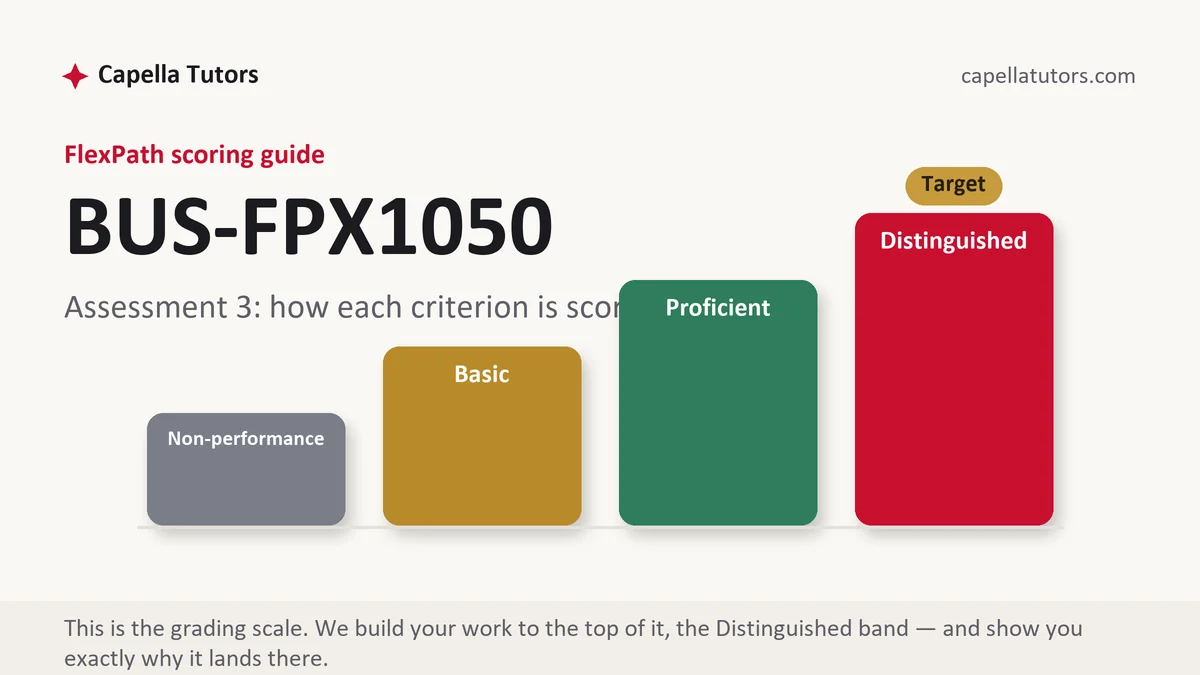
How BUS FPX 1050 Assessment 3 is scored
There are no letter grades in FlexPath. Each criterion on the scoring guide lands on one of four levels, and the level language is the writing brief:
| Level | What it means on a market structure and policy paper |
|---|---|
| Distinguished | The structure is defended on seller count, product similarity, and entry conditions, the policy effect is quantified as a shortage or surplus, and the burden is traced to the side that behaves less elastically. The assumption the prediction rests on is named. |
| Proficient | The structure is classified correctly and the policy effect is described in the right direction, without a quantity attached to it. |
| Basic | The four structures defined accurately, with the market in the prompt assigned to one of them by assertion rather than by evidence on entry or concentration. |
| Non-performance | A required element missing, most often the welfare or burden analysis, which is the row students read as optional commentary. |
Policy rows want a number. A ceiling described as causing shortages is the textbook sentence; a ceiling shown to leave a stated quantity unserved each week is the analysis the top column describes.
The BUS FPX 1050 Assessment 3 method, step by step
-
Build the outline from the guide and find the welfare row
Locate the criterion asking who gains and who loses, because it is the one most often answered in a closing sentence. Give it a heading of its own and the space a middle section would get.
-
Classify the market on three tests, not on instinct
Count the sellers, judge how alike the product is across them, and ask what it would cost a new firm to enter. A market with a handful of sellers, a near-identical product, and capital or licensing barriers is an oligopoly whatever the firms call themselves, and saying which test carried your classification is what makes it evidence.
-
Support the classification with a concentration figure
Market shares that sum to one hundred, a four-firm concentration ratio, or a Herfindahl index computed on the page all turn a label into a measurement. Show the sum so the reader can see the shares are complete.
-
State the policy, then predict from the model before looking at outcomes
A binding ceiling sits below the market-clearing price and produces a shortage; a binding floor sits above it and produces a surplus. Derive the direction first, then check it against the figures, and say in one clause which assumption the derivation rests on.
-
Quantify the gap and trace who carries it
Subtract quantity supplied from quantity demanded at the controlled price and report the difference with its unit and period. Then ask which side of the market has fewer alternatives in the short run, because that side absorbs most of the loss regardless of who the policy was written to protect.
-
Give the counterargument its sentence, then self-score
Every price control has a defense, usually about protecting buyers during a spike, and naming it is not a concession. Say what would have to be true in this market for the policy to work as intended, then grade each row yourself and submit early in the week.
A structure that maps to the criteria
These lengths are planning targets our tutors use for a structure and policy deliverable at this level, not Capella requirements; expand as your own guide demands.
| Section | What it must do | Guide word target |
|---|---|---|
| The market | The good, the geography, the sellers, and the period, with the boundary stated in a sentence. | ~175 words |
| Structure classified | Seller count, product similarity, and entry conditions, plus a concentration figure computed on the page. | ~325 words |
| Firm behavior | How pricing works under this structure, including the profit-maximizing condition where marginal revenue equals marginal cost. | ~250 words |
| The policy | The intervention, whether it binds, and the direction the model predicts before any data is consulted. | ~250 words |
| Quantified effect and burden | The shortage or surplus with its unit and period, and the side of the market that absorbs it, with a reason. | ~300 words |
| Counterargument and sources | The strongest case for the policy, what would make it work here, and official series cited by title and period. | ~175 words |
Annotated sample excerpt
An original model excerpt from our team, showing the register that scores at the top of the guide. It is study material: learn the moves, then write your own version.
Residential propane delivery in this three-county area is served by three firms, of which Two Rivers Propane holds an estimated 45 percent of deliveries against 33 and 22 percent for the others, giving a Herfindahl index of 2,025 plus 1,089 plus 484, or 3,598, and entry requires a bulk storage plant, a licensed tank fleet, and a driver certification that takes months.1 The product is close to identical across the three, so the structure is an oligopoly on all three tests rather than on the seller count alone.2 When the county capped delivered propane at $2.40 a gallon during a January cold spell, roughly 45 cents below the prevailing regional price, the model predicts a shortage before any figure is consulted, and the figures agree: at the capped price households sought about 96,000 gallons a week against roughly 71,000 offered, leaving 25,000 gallons of weekly demand unserved and rationed by waiting rather than by price.3
- 1Concentration computed on the page with the shares shown adding to one hundred, and entry barriers named concretely rather than called high.
- 2Says which tests carried the classification. Three tests passed is evidence; one test is a guess that happened to be right.
- 3Prediction derived from the model first, then confirmed with a quantified shortage carrying a unit and a period, and the rationing mechanism named.
The full premium sample for your exact assessment, written fresh to your scoring guide and issue, is free to request. Study it, revise it into your own voice, and submit work you understand.
The five mistakes that cost Distinguished
- A structure assigned by seller count alone. Product similarity and entry conditions are two thirds of the classification, and skipping them makes the label unsupported.
- A shortage with no size. Direction without magnitude is the textbook answer, and the policy row is asking for the magnitude.
- Concentration called high. An adjective where a computed index belongs is a rating with nothing behind it.
- Burden assumed to fall on whoever the policy names. Incidence follows relative elasticity, not legislative intent, and the criterion is testing whether you know that.
- Nominal prices compared across years. Dollars from different periods are different units, and the comparison undermines everything resting on it.
Pre-submission checklist
- The market bounded by good, geography, sellers, and period
- Structure defended on seller count, product similarity, and entry conditions together
- A concentration figure computed on the page with shares summing to one hundred
- The policy direction derived from the model before any data is consulted
- The shortage or surplus quantified with its unit and period, and the burden traced with a reason
- The counterargument given a sentence, sources cited by title and period, self-scored Distinguished
Want this assessment done with backup?
Send the prompt, the scoring guide, and the market or policy you were assigned. A team of eight returns a premium original sample with the structure defended on all three tests and the policy effect quantified, inside 24 to 48 hours, revised until it clears the guide.