Send the prompt, the criteria, and any spreadsheet the course gave you, and a premium original sample comes back inside 24 to 48 hours, aimed at the Distinguished descriptors, with a second reader checking that every figure in the narrative matches every figure in the tables. On a transcript the course reads BHA FPX 3008, Financial Management for Healthcare Organizations, worth 1.5 program points, an upper-division core requirement of the BS in Health Care Administration delivered in FlexPath, and one of the courses that counts toward the minimum of 27 points at the 3000 level or above in the 90-point degree. In Capella's catalog the course code is written BHA-FPX3008.
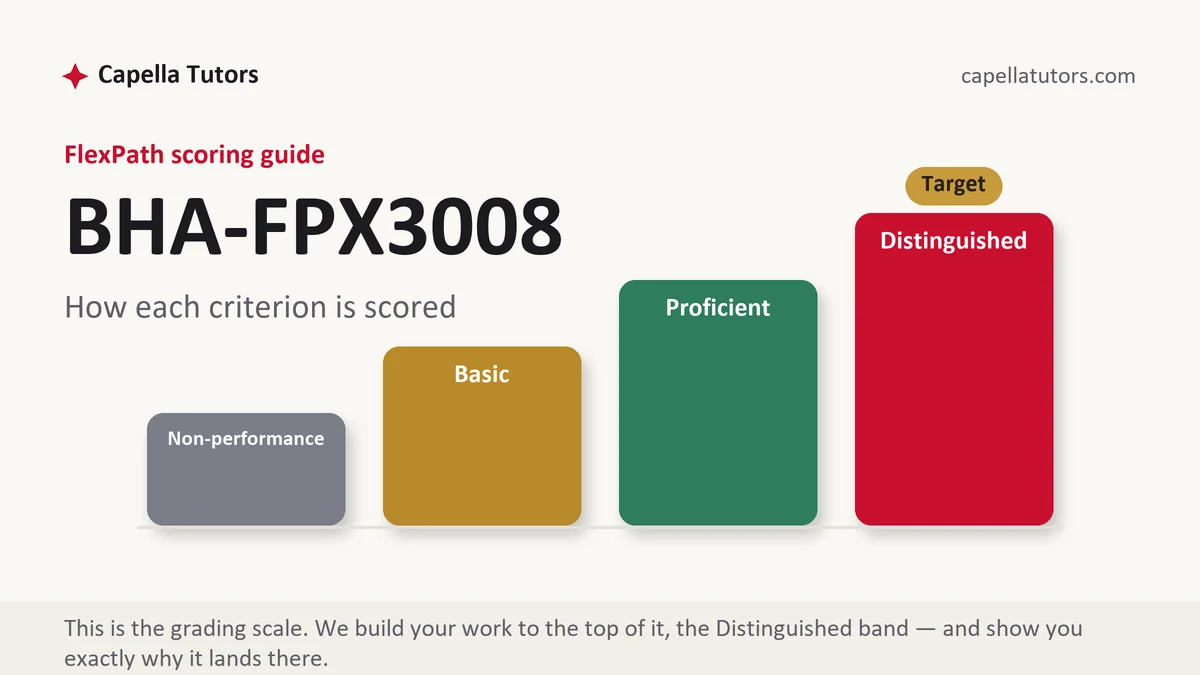
What BHA FPX 3008 actually grades
This is the course where the language of the finance office stops being background noise. The assessments in this course usually give you statements, a budget, or a set of operating figures and ask you to interpret them, so the criteria are checking whether you know what each document answers. A balance sheet answers what the organization owns and owes on one day. A statement of operations answers what it earned and spent across a period. A statement of cash flows answers where the money actually went, which is a separate question, because a healthy margin and an empty bank account happen together more often than students expect. Accrual accounting is what makes the third statement necessary, since revenue is recorded when the service is delivered rather than when the payment arrives, and in health care the gap between those two moments is measured in weeks.
The revenue vocabulary is the second thing being graded, and it is where drafts go wrong fastest. Gross charges are the list price and almost nobody pays them. Contractual allowances are the discounts written into agreements with payers. Net patient service revenue is what remains, and it is the only revenue figure that belongs in an analysis. A paper that describes a clinic as generating six million dollars when six million is the charge total has misread the organization by a factor that could be three. Alongside that sits the collection process, from registration and eligibility verification through charge capture, coding, claim submission, denial work, and patient collections, and the two indicators that summarize how well it runs are days in accounts receivable and the share of claims denied on first submission.
The third strand is cost behavior, which is the foundation for every decision question the course can ask. Costs that do not move with volume, such as rent, the salary of a practice manager, and the maintenance contract on an imaging unit, behave differently from costs that scale with each patient, such as supplies and the tests sent to a reference lab. Separating them is what lets you calculate a contribution margin and a break-even point, and it is what makes a budget variance interpretable, since a department that spent more because it saw more patients has not overspent in the way a department that spent more at the same volume has. Ratios close the picture, with operating margin, current ratio, and days cash on hand giving a board three different views of the same organization.
How we help in this course
Our 3008 drafts are built so the arithmetic can be audited. Every calculation appears with its inputs, subtotals reconcile to totals, tables agree with the sentences that describe them, and any assumption we had to make is stated on the page rather than buried in a spreadsheet cell. Where the course supplies a workbook we work inside it and keep your formulas visible, since a criterion about analysis is frequently graded partly on whether the reader can follow how a number was produced.
The commercial terms are standard for the studio. Work returns inside 24 to 48 hours written to the top column and passed through eight people before it reaches you, beginning with a research analyst who collects the scoring guide and any benchmark data, then a subject writer, then a scoring-guide reviewer who marks the draft criterion by criterion the way a Capella evaluator does, then an APA and originality pass, then an editor. One of those reads is spent on nothing but checking figures against each other. Revisions are free until the target is met and faculty feedback comes back through the same cycle at no charge.
The assessments, one by one
Assessment 1
The assessment usually hands you a set of financial statements, or asks you to find some, and expects an interpretation rather than a description: what the balance sheet says about position on one date, what the statement of operations says about performance across a period, what the statement of. Read the full Assessment 1 manual.
Assessment 2
The assessment usually gives you a service, a set of operating figures and a decision, and asks what the numbers say about it: which costs move with volume and which do not, what one more unit of service contributes, how many units cover the base, and what happens to that answer when one input changes. Read the full Assessment 2 manual.
Assessment 3
The assessment usually asks you to compare a budget with what actually happened and explain the difference to somebody who has to do something about it. Read the full Assessment 3 manual.
How to actually write BHA FPX 3008: where to begin
Turn the scoring guide into headings, then decide what each criterion needs in the way of a number. Financial assessments fail in a particular way: the writing is fine, the calculation is missing, and the criterion that asked for analysis received description. Attach at least one figure to every analytical criterion before you start drafting, and you will not lose a level to that.
Work the core calculation on a small case and the concepts stop being abstract. A clinic carries 46,000 dollars a month in costs that do not move with volume, spends 38 dollars in supplies and variable staffing on each visit, and collects an average of 112 dollars per visit in net revenue after contractual allowances. Each visit therefore contributes 74 dollars toward the fixed base, and the clinic covers that base at 46,000 divided by 74, which is 621.6 visits, so 622 visits in a month. Across 21 operating days that is roughly 30 visits a day. Now change one input the way real life changes it. A contract renegotiation and a shift in payer mix pull average net revenue per visit down to 104 dollars. The contribution falls to 66 dollars, break-even rises to 697 visits, and the clinic now needs about 33 visits a day to stand still. Eight dollars of revenue per visit moved the requirement by more than 70 visits a month, and writing that sentence is worth more than a page of description.
Variance analysis follows the same discipline of separating causes. Suppose the budget assumed 700 visits at 112 dollars, or 78,400 dollars, and the month closed at 660 visits averaging 118 dollars, or 77,880 dollars. The headline is a shortfall of 520 dollars, which invites a shrug. Decomposed, it says something a manager can act on: 40 visits short of budget at the budgeted rate is 4,480 dollars unfavorable on volume, while six dollars more per visit across 660 visits is 3,960 dollars favorable on rate, and the two nearly cancel. Volume is a marketing and access problem, rate is a contracting and payer mix outcome, and they belong to different people. Report both, then say which one you would work on first and why.
| Section | What goes in it | What Distinguished looks like |
|---|---|---|
| Reading the statements | What each statement covers, the period or date, and the two or three lines that matter here. | The three documents used together, with the cash question kept separate from the margin question. |
| Revenue definitions | Gross charges, contractual allowances, net patient service revenue, and what was actually collected. | Analysis conducted on net revenue throughout, with charges used only where charges are the point. |
| Cost structure | Costs sorted into those that move with volume and those that do not, with the basis stated. | A contribution margin and a break-even figure produced from the sorted costs. |
| Budget and variance | The budget assumptions, the actual result, and the difference split by cause. | Volume and rate effects separated and assigned to the function that controls each. |
| Ratios and position | Operating margin, liquidity, and days cash on hand, each against a benchmark and a period. | Ratios interpreted as a trend against a peer figure rather than reported as values. |
| Recommendation and format | What the numbers imply, what it costs, who acts, and references in current APA. | A recommendation whose dollar effect is estimated and whose main assumption is tested. |
Developing the analysis
Health care finance carries a few arguments that an upper-division paper can use to show judgment. Most hospitals in the United States operate as nonprofit corporations, which means margin is retained for reinvestment rather than distributed, and the debate about whether the tax exemption is earned by the community benefit provided is genuinely unsettled and easy to reference honestly. Sector margins are another useful tension, since aggregate figures conceal a wide spread in which a minority of organizations earn most of the reported surplus while a substantial group runs at a loss, so quoting an average margin as though it described a typical hospital misleads your reader. Benchmarking deserves the same caution: a ratio only means something against a peer group matched on size, ownership, case mix, and region, and against the same year. Say which comparison you chose and why the comparison is fair. That sentence is what turns a set of computed ratios into an analysis.
Citations that survive faculty review
Four sources cover nearly every claim a financial assessment needs. Audited financial statements and the annual information return filed by tax-exempt organizations are public for most nonprofit health systems, and using a real organization's own filing rather than a generic example raises the quality of a paper immediately. The commission that advises Congress on federal payment publishes sector-wide margin and cost analysis that is authoritative and freely available. The professional association for health care financial management supplies definitions, revenue cycle metrics, and the standard formulas your instructor is expecting. Peer-reviewed health economics and health services research supplies the argument. Give every figure a fiscal year, because organizations do not all close in December and comparing a July to June year against a calendar year without noting it is an error a finance reader will catch. Textbooks are acceptable for a formula and weak as evidence for a claim about the sector, and the reference list gets checked against the text both ways in current APA.
The mistakes that land Basic instead of Distinguished
- Analyzing charges as if they were revenue. The gap between the list price and the negotiated payment is the whole subject, and ignoring it invalidates every number that follows.
- Treating every cost as variable. Without the fixed and variable split there is no contribution margin, no break-even, and no usable variance.
- A ratio with no benchmark and no year. An operating margin of 2.1 percent is neither good nor bad until it has something to sit against.
- Tables that disagree with the narrative. One mismatched total tells the reader to distrust the whole document, and it usually costs more than one criterion.
- Recommending cost reduction in general. Name the line, the amount, the owner, and what the organization gives up to get it.
BHA FPX 3008 questions students actually ask
Where do I get real financial statements for an assignment?
Public filings, and they are easier to find than students expect. Tax-exempt health systems file an annual information return that is available through several free repositories, and it carries revenue, expenses, executive compensation, and a community benefit schedule. Many nonprofit systems that issue bonds publish audited statements and quarterly disclosure on investor pages because their bondholders require it. Publicly traded companies file annual reports with the securities regulator. Any of these gives you a real organization, real numbers, and a fiscal year to name. If your instructor supplies a case workbook, use it and do not substitute, since criteria are frequently written against the figures in that file.
Does the spreadsheet get graded, or only the paper?
Assume both are read and build the file accordingly. Keep inputs in labeled cells, use formulas rather than typed results so a reviewer can see how a total was produced, name each tab for what it holds, and put the assumptions on the sheet rather than in your head. Then carry the important numbers into the narrative in words, because a criterion is graded on the document your instructor is reading, and a figure that exists only inside a cell has not been argued. Where the submission is a paper alone, present the calculation in a small table with the inputs shown, so the reader can follow the arithmetic without opening anything.
My calculation does not come out to a whole number. Do I round?
Round at the end and say what you did. Break-even in visits counts real patients, so 621.6 becomes 622, and it rounds up rather than to the nearest value because 621 leaves the month short. Dollar figures hold two decimals inside a table and are sensibly rounded in the narrative, provided the rounded version does not contradict the table. Percentages carry one decimal in most health care reporting. What causes trouble is rounding early and then building on the rounded figure, since the error compounds and your totals stop reconciling, which a finance reader notices faster than anything else in the paper.
Financial assessment due?
Send the prompt, the criteria, and the workbook. Every calculation comes back visible and reconciled to the narrative. Your first premium sample is on us.