Send the prompt and the scoring guide and a premium original sample comes back inside 24 to 48 hours with the service area defined, the forecast built, every assumption declared and revisions free until the criteria clear. The course identity: MHA FPX 5010, Strategic Healthcare Planning, worth 2 program points, a core course inside Capella's FlexPath Master of Health Administration, which asks for at least 24 program points across twelve courses, 20 of those points in core work and 4 in electives. MHA5010 and MHA FPX 5010 both point here. In Capella's catalog the course code is written MHA-FPX5010.
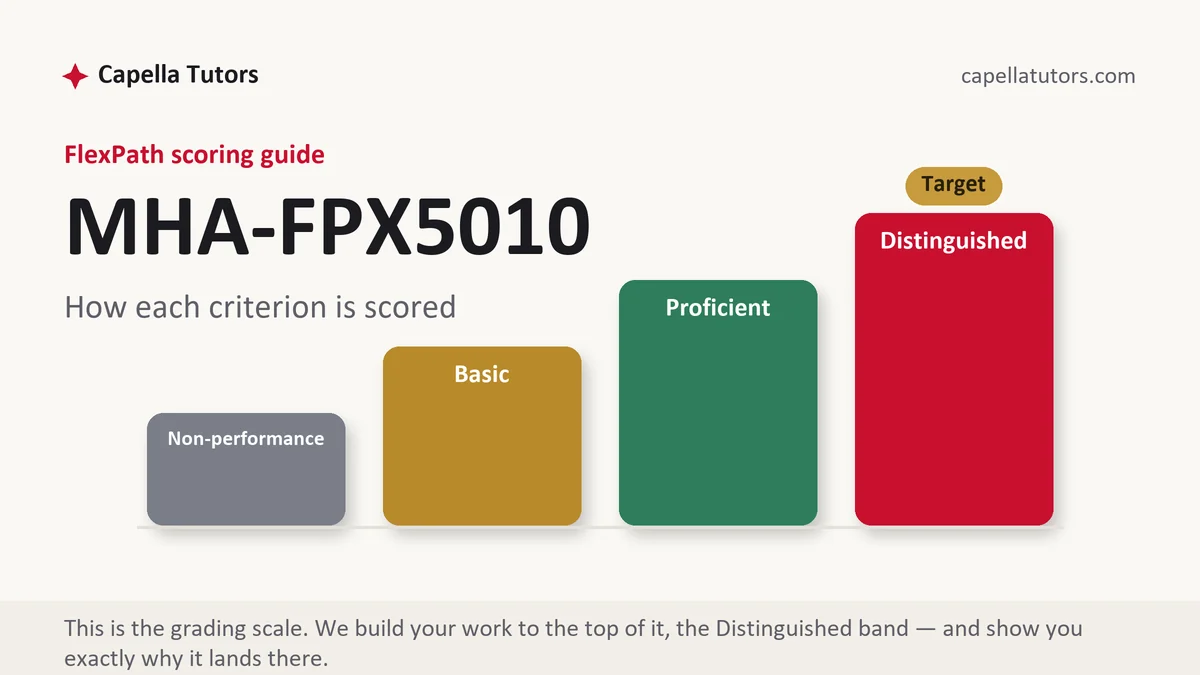
What MHA FPX 5010 actually grades
This course grades whether you can produce a plan a board would adopt rather than an essay about planning. The criteria follow the sequence a real planning cycle follows: define the market the organization actually serves, scan its environment with numbers rather than adjectives, establish where it stands against the competitors in that market, choose a direction the mission can defend, then commit to objectives carrying a baseline, a target, a date and an owner. A document that stops at analysis has failed the criterion that matters most, because a plan is a set of commitments and an analysis is not.
The environmental scan is where most submissions quietly go wrong. A scan is not a list of national trends copied out of a trade publication. It is a description of one service area: how many people live in it, how old they are, how their coverage is distributed, what they consume per thousand population, which facilities they currently drive past to reach a competitor, and what that competitor has announced it will build next. Distinguished work makes the scan quantitative and local. Basic work observes that the population is aging and reimbursement pressure is rising, both true everywhere and therefore decisive nowhere.
The third strand is fit between direction and capability, graded harder than students expect. A direction the organization cannot staff, finance or license is not a strategy, so expect criteria that want the capital consequence, the workforce consequence, the regulatory step where your state imposes one, and an internal capability assessment saying which of those you already hold. The law and policy course numbered NHS FPX 6004 in the same core supplies the regulatory half of that argument. Frameworks appear here as tools rather than as sections: a matrix that names four quadrants and never returns is worth nothing, while one that produces a decision earns the criterion.
How we help in this course
Tell us the organization, the geography, the service line and whatever internal figures you can share, and the sample arrives with the market arithmetic already done: the service area defined from origin data or from a stated proxy, demand estimated from a cited use rate, share calculated against a denominator we name in the text, and the capacity consequence of the growth you propose worked out in beds, rooms or session slots. Where your organization has to stay confidential we build the same analysis around a comparable public system and say plainly that is what we did.
The rest runs on studio terms. A premium original deliverable inside 24 to 48 hours, written to the Distinguished column of the guide you send, eight people in the pipeline including a reviewer whose only assignment is confirming that the forecast, the objectives and the implementation plan all describe the same volume. Revisions cost nothing and continue until the criteria clear, and anything faculty send back re-enters the same cycle free.
The assessments, one by one
Assessment 1
Assessment 1 of MHA FPX 5010, Strategic Healthcare Planning, is the evidence base the rest of the course spends. Read the full Assessment 1 manual.
Assessment 2: TOWS Matrix Analysis and Strategic Planning
Build a TOWS matrix from the environmental analysis, generate SO, WO, ST and WT strategies, and recommend the strategies the organization should pursue. Read the full Assessment 2 manual.
Assessment 3
The final deliverable in the sequence is the one that has to commit. Read the full Assessment 3 manual.
How to actually write MHA FPX 5010: where to begin
Turn the scoring guide into your outline before you read another trend report. Each criterion becomes a heading, the Distinguished sentence goes underneath it, and every figure you gather afterwards gets attached to the criterion it serves. The assessments in this course usually ask you to analyze an organization's position and then produce some part of a plan for it, and your scoring guide decides whether that lands as a written plan, an executive briefing, a scan document or a presentation with notes, so let the guide fix the format before you build anything.
Then build the demand estimate, because a plan without one is a preference. The figures here are constructed to show the method; yours come from the datasets named below. Say the primary service area holds 246,000 residents and the regional inpatient use rate is 92 discharges per 1,000 population. Total market demand is 246 times 92, or 22,632 discharges. Your hospital recorded 4,980 of them, so share is 4,980 divided by 22,632, which is 22.0 percent, against a competitor holding 31 percent. Set a target of 24 percent within three years and the plan owes 5,432 discharges, an increase of 452. At a contribution margin of $1,180 a discharge that growth is worth $533,360 a year, and at an average length of stay of 4.1 days it consumes 1,853 extra patient days, which is 5.1 more occupied beds. The strategy now has a number, a value and a physical consequence, which is three criteria answered by one calculation.
Then stress the assumption everyone leaves flat. Population is not static: grow those 246,000 residents at 1.4 percent a year and three years later the area holds about 256,500 people, so market demand rises to roughly 23,600 discharges and the same 24 percent share becomes 5,663 cases rather than 5,432. Those 231 discharges are the difference between a capital plan that works and one that runs out of beds in year three. Use rates move as well, and they move faster than population, because procedures migrate to outpatient settings and shift the denominator underneath you. Print the year of any use rate you borrow, and if the rate is older than your planning horizon, say what you did about it rather than hoping nobody checks.
Then write objectives that can be audited. Each one takes a baseline, a target, a date, a named owner and a source of measurement, and the plan carries fewer of them than you want to write. Four objectives with owners beat eleven aspirations. Attach the resource to each objective, name the risk that would stop it, and state the review cycle, quarterly against a dashboard the organization already produces rather than an instrument somebody would first have to invent. Then say what the plan does if the competitor's announced project opens on schedule, because a strategy with no contingency is a forecast wearing a plan's clothing.
| Section | What goes in it | What Distinguished looks like |
|---|---|---|
| Service area and scan | The market defined geographically, with demographics, coverage and utilization. | A scan built from named datasets, local rather than national, with the data year on every figure. |
| Demand forecast | Population, use rate and share, projected across the planning horizon. | A forecast that moves population and use rate, with the sensitivity of the answer stated. |
| Competitive position | The competitor set, their volumes, their capacity and their announced projects. | Share computed against a denominator you defend, with the competitor's next move accounted for. |
| Strategy and objectives | The chosen direction, and the objectives that will deliver it. | Objectives with baseline, target, date, owner and measurement source, tied back to the mission. |
| Implementation and resources | Capital, workforce, space, and any regulatory approval required. | The forecast volume reconciled to the beds, staffing and dollars in the implementation plan. |
| Monitoring and references | The dashboard, the cadence, the contingency, and current APA both ways. | Measures the organization already reports, reviewed on a named cycle, every figure traceable. |
Developing the analysis
Strategic planning literature is not short of frameworks and is short of agreement, so the analysis criterion rewards a writer who arbitrates. The volume and outcome relationship, whether concentrating a procedure in fewer centers improves results, is well studied and still contested at the margins, and it matters here because it is the strongest argument both for and against consolidating a service line. Evidence on health system consolidation points two ways at once, toward scale efficiencies and toward higher negotiated prices, and a plan citing only the half it likes is doing advocacy rather than analysis.
Read the design before the conclusion and weigh the setting hardest of all: a strategy validated inside a metropolitan academic system rarely transfers intact to a two hospital rural network with a different payer mix and a different physician supply. Attribute the frameworks you use to the people who wrote them rather than to a summary slide, and when a framework runs out of explanatory power, say so and argue from your own numbers instead.
Citations that survive faculty review
Planning documents are graded partly on where their numbers came from. Population and demographic figures come from the federal census program and its annual survey, cited as datasets with the vintage year, not from a news article quoting them. Utilization and case mix come from state discharge databases and federal utilization projects, and the year matters because service lines migrate between inpatient and outpatient settings faster than a planning horizon closes. Facility level capacity, ownership and service data come from federal provider files and from the national hospital association's annual survey, cited as data reports with their survey year. Peer-reviewed strategy, health services and management journals through the Capella library carry the causal and comparative claims.
State certificate of need statutes and state health department planning documents are cited as law or as agency publications wherever your project would need an approval, and naming which state's rules apply is itself a mark of a serious plan. Where two sources disagree because of a reporting lag or a definitional difference, say so in the text; noticing the discrepancy is worth more to an evaluator than a tidy table that hides it.
The mistakes that land Basic instead of Distinguished
- A SWOT with no numbers inside it, which produces four lists and no decision.
- A forecast holding population and use rate constant across the horizon, which understates demand and dates the plan on arrival.
- Market share computed on a service area drawn to flatter the organization, which no board accepts twice.
- Objectives with no baseline, no date and no owner, which makes the monitoring section unwritable.
- A direction with no capital, staffing or licensing consequence attached, which is a preference rather than a plan.
MHA FPX 5010 questions students actually ask
How do I define the service area?
By where the patients actually come from, not by county lines. Sort your discharges or visits by patient origin, usually zip code, largest first, and accumulate until you reach roughly 70 to 75 percent of volume; those zip codes are the primary service area, and the next band out to about 90 percent is secondary. Report the threshold you used, because it changes every share figure downstream. With no origin data at all, use drive time as a proxy, state that assumption plainly, and test it against where the competing facilities sit, since a market definition that ignores a competitor twelve minutes away is a market you invented.
Where do use rates and competitor volumes come from without internal access?
Most of it is public once you know what it is called. Many states publish facility level discharge and outpatient volumes, often by service line or diagnosis group, with a lag of a year or two that you disclose rather than hide. Federal utilization projects give national and regional rates per population that you can apply to a local denominator. Provider files list bed counts, ownership and services facility by facility. Competitor intentions usually appear in their own capital announcements, community health needs assessments and press releases, all of which are citable. Build the competitive picture from those, print the vintage beside each figure, and reconcile the gaps in the text.
How many strategic objectives should the plan carry?
Fewer than the number you can think of, and each one written so a monitoring report can pass or fail it. Three to five objectives per strategic direction is a plan an executive team can actually run; a dozen is a wish list that gets abandoned by the second quarter. Every objective needs a baseline you can cite, a target, a date, a named owner and the report that will measure it. If two objectives depend on the same constrained resource, say which one yields when that resource runs short, because that sentence is what makes the document a plan rather than a list of good intentions.
Planning deliverable in front of you?
Send the guide, the organization and the geography. First premium sample free, and the market arithmetic comes with it.