This manual is for MHA FPX 5010 Assessment 2, start to submission. TOWS Matrix Analysis and Strategic Planning takes the environmental analysis from Assessment 1 and turns it into strategy: you build a TOWS matrix that pairs the organization's internal strengths and weaknesses with external opportunities and threats, generate strengths-opportunities, weaknesses-opportunities, strengths-threats and weaknesses-threats strategies, then analyze them and recommend which to pursue. The grade turns on the pairing. A list of strengths and threats is a SWOT; a TOWS earns its marks when each strategy uses a specific internal factor to act on a specific external one. Below is the method our tutors use, a structure that maps to the criteria, and an annotated sample excerpt. Prefer to hand it off? A premium original sample for this exact assessment comes back in 24 to 48 hours, revised free until it meets the guide. Capella's catalog lists the course as MHA-FPX5010, and some courserooms print MHA5010; both point to this same Assessment 2. In current courserooms this assessment typically appears as "TOWS Matrix Analysis and Strategic Planning".
One honesty note before the manual: Capella revises courses and scoring guides over time, so always write to the exact scoring guide attached to your assessment in the courseroom. The course identity above is verified on capella.edu; the method and structure below are our tutors' approach to it, not Capella's official rubric text.
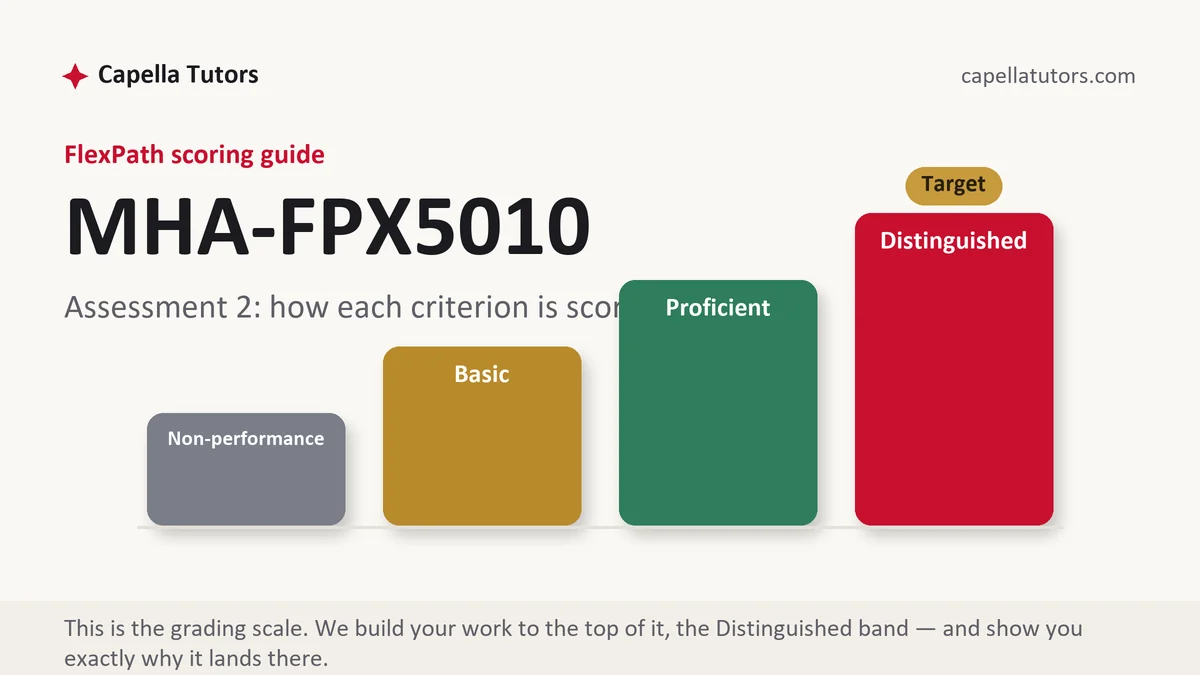
How MHA FPX 5010 Assessment 2 is scored
FlexPath does not use letter grades. Each criterion in the scoring guide lands on one of four levels, and the level descriptions are the real writing brief:
| Level | What it means on a TOWS analysis |
|---|---|
| Distinguished | Every factor comes from the Assessment 1 analysis with evidence, each strategy pairs specific factors, all four quadrants are developed, strategies are evaluated for feasibility and fit with the mission, and the recommendation is clear. |
| Proficient | The matrix is complete and accurate, but strategies are loosely tied to the factors and the evaluation is brief. |
| Basic | The paper presents a SWOT with general strategies. |
| Non-performance | A quadrant, the analysis or the recommendation is missing. |
Carry the organization and findings from Assessment 1 forward unchanged. Assessment 3 builds directional strategies from what you recommend here.
The MHA FPX 5010 Assessment 2 method, step by step
-
List the factors
Three or four strengths, weaknesses, opportunities and threats from your environmental analysis, each supported.
-
Build the matrix
A table with the internal factors on one axis and the external on the other.
-
Write SO strategies
Use strengths to seize opportunities, each naming the specific strength and opportunity.
-
Write WO, ST and WT strategies
Overcome weaknesses using opportunities, use strengths against threats, and minimize weaknesses while avoiding threats.
-
Analyze the strategies
Judge each for cost, feasibility, risk and fit with mission.
-
Recommend
Choose the strategies to pursue first and explain why.
A structure that maps to the criteria
Word counts are planning targets our tutors use, not Capella rules; follow the length and format your scoring guide states.
| Section | What it must do | Guide |
|---|---|---|
| Introduction | The organization and the purpose of the TOWS. | ~100 words |
| TOWS matrix | Factors and strategies in table form. | one table |
| SO and WO strategies | Strategies with the factors they pair. | ~200 words |
| ST and WT strategies | Strategies with the factors they pair. | ~200 words |
| Analysis | Feasibility, risk and mission fit. | ~200 words |
| Recommendation and references | Strategies to pursue, then current APA. | ~125 words |
Annotated sample excerpt
An original model excerpt from our team, written to show the register that reaches the top of the guide. Learn the moves, then write your own version.
The hospital's strongest internal asset is its cardiology program, which already performs above state benchmarks for heart attack survival, and its largest external opportunity is the growth of the over-65 population in the three counties to the east, where no competitor offers outpatient cardiac rehabilitation.1 The SO strategy that pairs them is to open a cardiac rehabilitation clinic in the eastern service area staffed from the existing program, which uses a proven strength to claim unserved demand.2 Its feasibility depends on staffing, a weakness the matrix also records, so the analysis ranks it first but ties the opening date to the recruitment strategy in the WO quadrant.3
- 1Names the specific strength and opportunity with evidence.
- 2States a strategy that genuinely pairs them.
- 3Evaluates feasibility by connecting to another quadrant.
The full premium sample for your exact assessment, written fresh to your scoring guide and topic, is free to request. Study it, revise it into your own voice, and submit work you understand.
The five mistakes that cost Distinguished
- A SWOT instead of a TOWS. Pair factors to produce strategies.
- Strategies not linked to factors. Name the factors each strategy uses.
- Empty quadrants. Develop all four.
- No evaluation. Judge feasibility and mission fit.
- New facts. Build on Assessment 1.
Pre-submission checklist
- Factors carried from Assessment 1 with evidence
- Complete TOWS matrix
- SO, WO, ST and WT strategies each pairing factors
- Strategies evaluated
- Clear recommendation
- Current APA references
Want the TOWS analysis done?
Send the scoring guide and your Assessment 1 analysis. Our team returns a premium original TOWS analysis in 24 to 48 hours, revised free until it meets the guide.