This manual is for MHA FPX 5010 Assessment 1, start to submission. Assessment 1 of MHA FPX 5010, Strategic Healthcare Planning, is the evidence base the rest of the course spends. The assessment usually asks you to define the market an organization actually serves and to scan its environment with numbers rather than adjectives. A scan copied out of a trade publication describes everywhere and therefore decides nothing, which is the most common reason a first attempt sits in the Basic column. Every criterion is judged on its own against the scoring guide sitting in your courseroom. Below is the gathering order our tutors use, the sections it fills, and an annotated sample excerpt. Rather hand it off? A premium original sample for this exact assessment arrives in 24 to 48 hours with the market arithmetic already done, revised free until the criteria clear. Capella's catalog lists the course as MHA-FPX5010, and some courserooms print MHA5010; both point to this same Assessment 1. In current courserooms this assessment typically appears as "Current Environmental Analysis".
One honesty note before the manual: Capella revises courses and scoring guides over time, so always write to the exact scoring guide attached to your assessment in the courseroom. The course identity above is verified on capella.edu; the method and structure below are our tutors' approach to it, not Capella's official rubric text.
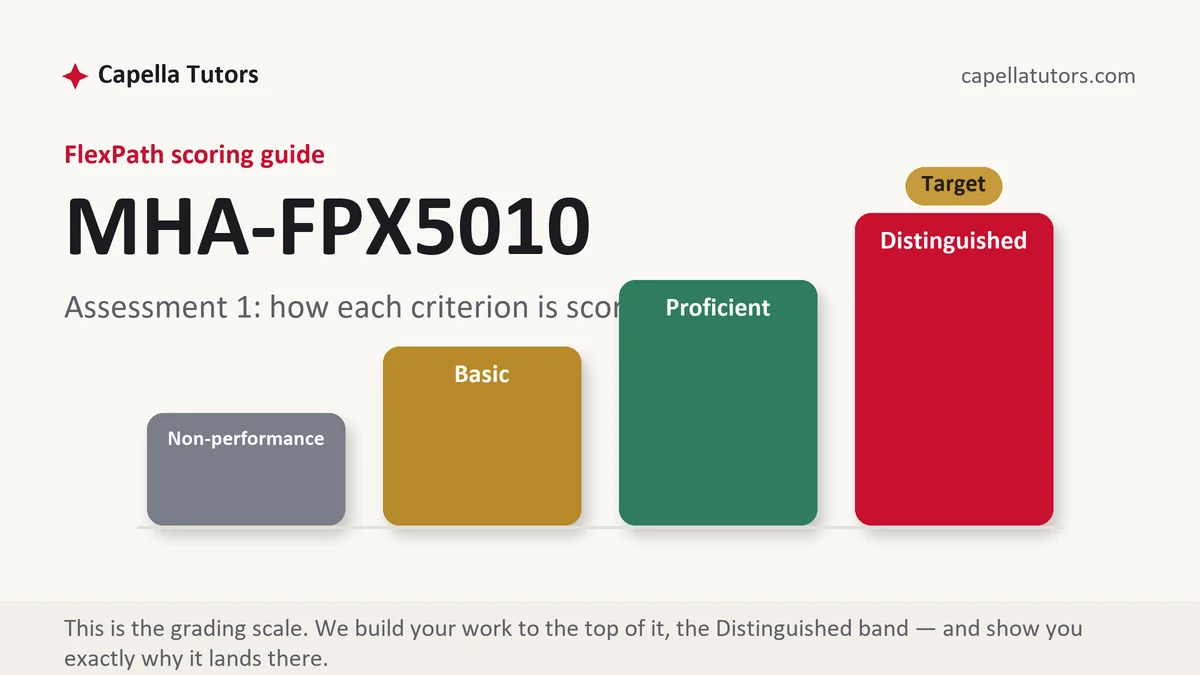
How MHA FPX 5010 Assessment 1 is scored
Each criterion gets one of four judgments and none of them is negotiable by volume of writing. On a scan they mean this:
| Level | What it means on an environmental scan |
|---|---|
| Distinguished | The service area is drawn from origin data or a declared proxy, every figure carries a dataset and a vintage year, and the scan closes by naming which findings will decide the strategy. The extra move is written into your criterion; do it plainly. |
| Proficient | The scan is local, sourced and complete. It usually stops one step short by describing conditions without saying which of them matter. |
| Basic | National trends restated. The population is aging, reimbursement is tightening, consumers expect convenience, all true everywhere and decisive nowhere. |
| Non-performance | A required element of the scan is missing, most often the internal capability side or the competitor set, and the criterion has nothing to assess. |
A scan is not neutral reporting. It is the document that later has to justify a direction, so gather what you intend to spend and say as you go which findings you plan to spend.
The MHA FPX 5010 Assessment 1 method, step by step
-
Let the guide fix the format before you gather anything
Each criterion becomes a heading with its Distinguished sentence underneath, and every figure you collect afterwards gets filed under the criterion it serves. Your scoring guide decides whether the result is a written scan, an executive briefing or a presentation with notes, and that decision changes how much narrative each figure needs.
-
Draw the service area from where patients actually come from
Sort volume by patient origin, largest first, and accumulate to roughly 70 to 75 percent for the primary area, with the next band out to about 90 percent as secondary. Report the threshold you used, because every share figure downstream depends on it. With no origin data, use drive time, say so, and check the assumption against where the competing facilities sit.
-
Describe the population with datasets, not impressions
Counts, age distribution, coverage mix and income for the area you just defined, each cited to the federal census program or its annual survey with the vintage year attached. A news article quoting a dataset is not the dataset, and a criterion about sourcing will notice the difference.
-
Convert population into demand
Apply a use rate per thousand population from a federal utilization project or a state discharge database, print the year of the rate, and say what you did if the rate is older than your planning horizon. Demand estimated this way can be audited; demand asserted cannot.
-
Map the competitors, including what they have announced
Bed counts, ownership, service lines and volumes come from federal provider files, state discharge data and hospital association surveys. Intentions come from capital announcements, community health needs assessments and press releases, all citable. A competitor's next building belongs in the scan that predates it.
-
Close by naming what will decide the strategy, then self-score
Two or three findings, flagged as the ones a later plan has to answer. That paragraph converts a survey into an argument in progress and answers the criteria about strategic significance. Then mark the draft against each criterion and fix what falls short before submitting.
A structure that maps to the criteria
Planning targets from our tutors for a typical 5010 scan. Your scoring guide replaces any of them.
| Section | What it must do | Guide |
|---|---|---|
| Organization and purpose | The entity, its mission, and the strategic question the scan is being built to answer. | ~150 words |
| Service area definition | The geography, the method used to draw it, and the threshold you accumulated to. | ~200 words |
| Population and coverage | Counts, age structure, payer coverage and income, every figure with a dataset and a vintage. | ~300 words |
| Demand and utilization | Use rates applied to the local denominator, with the year of the rate stated. | ~250 words |
| Competitive environment | The competitor set, their capacity and volumes, and their announced projects. | ~300 words |
| Findings and references | The two or three results that will decide the strategy, plus APA checked both ways. | ~200 words |
Annotated sample excerpt
A model scan finding from our planning team, annotated where it earns its criteria. Use the method and supply your own market.
The obstetrics unit at Two Rivers Regional, 34 miles north in the adjoining county, closed to deliveries in March, and the 780 births it recorded in its last full year now have to travel somewhere.1 Origin data already places nine of that county's zip codes inside our secondary band, and at the 2024 county birth rate of 10.9 per 1,000 against a population of 71,400 the vacated market is roughly 778 births, of which drive time favors us for about 40 percent and favors the metropolitan system to the south for the rest.2 That is 311 additional deliveries against our current 1,190, a 26 percent volume increase arriving whether or not we plan for it, and our labor and delivery suite holds eight beds.3
- 1The scan opens on a change with a date on it rather than on a national trend. A closure 34 miles away moves a market; an aging population does not distinguish this market from any other.
- 2The estimate is rebuilt from a published rate and a stated population rather than borrowed from the closed unit's own count, and the split between competitors is reasoned from drive time rather than assumed.
- 3The finding lands on a physical constraint. A scan that ends in beds, rooms or session slots has already handed the planning section its first problem.
The full premium sample for your exact assessment, written fresh to your scoring guide and issue, is free to request. Study it, revise it into your own voice, and submit work you understand.
The five mistakes that cost Distinguished
- The borrowed trend list. A scan assembled from a consulting firm's national outlook says nothing about the county the organization actually operates in.
- An area drawn to flatter. Service areas chosen so that share looks strong get corrected in the first board meeting and never trusted again.
- Undated figures. A use rate or a population count with no vintage attached cannot be reconciled against anything, and service lines move between settings faster than a planning horizon closes.
- Competitors as a list of names. Without capacity, volumes and announced projects, the competitive section describes the neighborhood rather than the contest.
- A scan with no verdict. Findings never flagged as decisive leave the strategic significance criteria unanswered and the next deliverable without a starting point.
Pre-submission checklist
- Service area drawn from origin data or a declared proxy, with the threshold printed
- Every population and utilization figure carrying a dataset name and a vintage year
- Use rates applied to the local denominator, with the arithmetic visible
- Competitor capacity, volumes and announced projects, each cited
- Two or three findings explicitly flagged as the ones that will decide the strategy
- Datasets and agency publications cited as what they are, APA checked both ways
Scan due and no internal data?
Tell us the organization, the geography and the service line. We define the area from public origin proxies, build the population and utilization layers from named datasets, and assemble the competitor picture from provider files and capital announcements. Back in 24 to 48 hours, revised free until the criteria clear.