Send the dataset, the prompt, and the criteria attached to them, and a premium original sample comes back inside 24 to 48 hours with the model justified entity by entity, every statistic reported alongside the assumption it rests on, and a second reader confirming that the figures in the narrative match the figures in the tables. Capella lists this one as IT FPX 4345, Data Modeling and Statistical Analysis, an IT-FPX offering that appears as an elective or a specialization-eligible choice rather than a fixture on every plan, taught in FlexPath within a BS in Information Technology built on at least 90 program points including a minimum of 27 earned at the 3000 level or above. Confirm the point value and the slot it fills against your own program evaluation, since that record is what the registrar reads. In Capella's catalog the course code is written IT-FPX4345.
What IT FPX 4345 actually grades
Two disciplines share one deliverable here, and the criteria test whether you can hold both at once. The modeling half asks you to turn a described situation into a structure: entities that deserve their own table, attributes that belong to exactly one of them, relationships with the cardinality stated in words a reader can check, and a primary key chosen rather than defaulted to. Normal forms are the vocabulary for that work. First normal form removes repeating groups from a single column, second removes attributes that depend on only part of a composite key, third removes attributes that depend on another non-key attribute instead of on the key, and Boyce-Codd tightens the third where a candidate key overlaps. Evaluators are not looking for a recital of those definitions. They are looking for a design where you can point at any column and say which key determines it.
The statistical half is graded on restraint. Descriptive work comes first because it is what tells you whether inferential work is even legitimate: the shape of the distribution, the spread, the missing values, and the outliers you decided to keep or drop with a stated reason. Level of measurement drives the choice of test, so nominal, ordinal, interval, and ratio data are not academic labels but the thing that rules out three quarters of the options on the menu. The distinction most submissions get wrong involves the p-value, which is the probability of seeing data at least this extreme if the null hypothesis were true, and not the probability that the null hypothesis is true. Confidence intervals communicate precision in the units of the problem, effect sizes communicate magnitude, and a result can be statistically detectable and operationally irrelevant at the same time. Sampling receives the same scrutiny. A convenience sample built from whoever happened to answer a survey link supports a description of those respondents and nothing wider, and the criteria expect that boundary stated rather than quietly passed over. Missing values are a finding in their own right, so count them, say whether they appear at random or cluster inside one group, and record what you did about them, because dropping every incomplete row silently changes who the analysis is about.
The seam between the halves is where the top column lives. A schema decides which questions can be answered at all, because a metric you never stored a timestamp for cannot be trended, and a rate you cannot put a denominator under is a count wearing a percent sign. That is also where the governance criteria attach: which columns are personally identifying, how long the data is kept, and whether an analysis dataset should have been de-identified before anybody queried it. Undergraduate work in this course is expected to name those constraints, not to solve them at the level of a compliance officer, but a paper that models patient or payroll data and never mentions classification or retention leaves an obvious criterion untouched.
How we help in this course
Analytics drafts from this studio arrive with their reasoning exposed. The entity relationship model is described in text that names every table, key, and relationship so you can reproduce the diagram in whatever tool your faculty accepts, each normalization step says which dependency it removed, and any deliberate denormalization is labelled as a choice with the read pattern that justified it. On the statistics side you get the assumption checks written out, the test named with the reason it fits the measurement level, the effect size next to the significance, and a limitations paragraph that says what the sample cannot support. Give us the dataset or its column list, the scenario, and the criteria, and the analysis will be about your data rather than a textbook example.
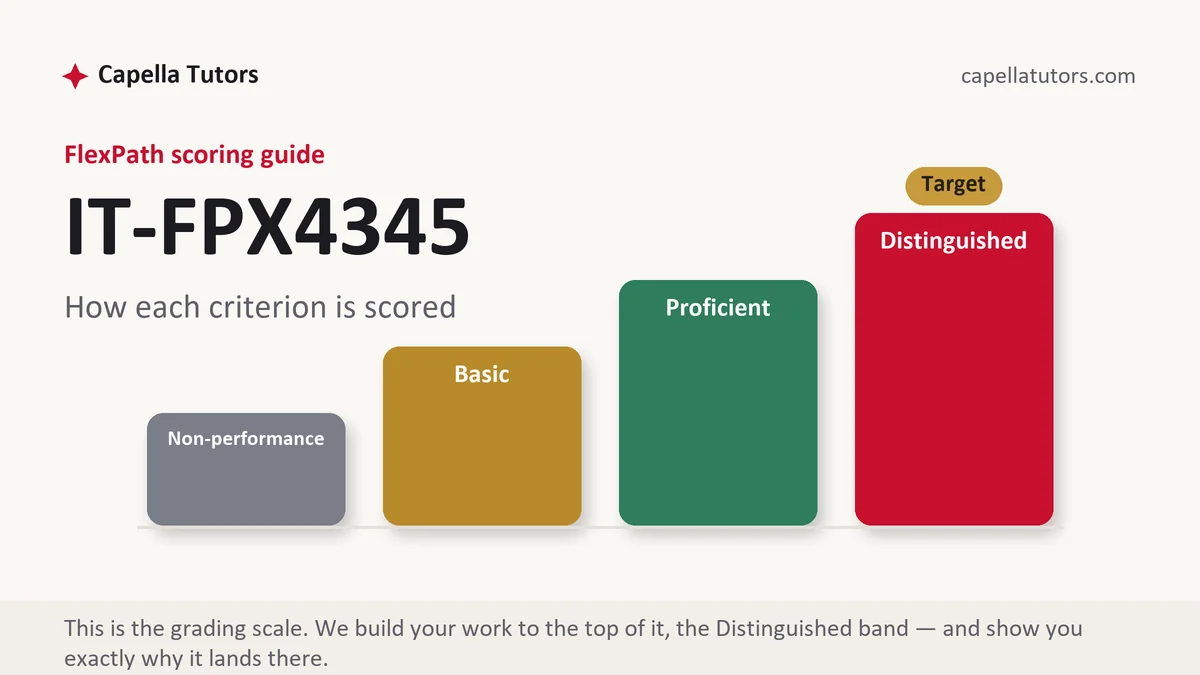
The commercial terms are the same ones the rest of the site runs on. Turnaround is 24 to 48 hours, the target is the Distinguished descriptor rather than a pass, and eight people touch the file before you see it, starting with a researcher who reads your scoring guide, then a subject writer who builds the model and runs the analysis, then a reviewer who scores the draft against each criterion the way your evaluator will, then an APA and originality check, then an editor. One of those passes exists only to recompute every number in the document and confirm the tables and the prose agree. Revisions cost nothing until the guide is met, returned faculty comments re-enter the queue free, and since an evaluated attempt can sit with faculty for two business days, submitting early is the only scheduling trick that reliably works.
The assessments, one by one
Assessment 1
The opening deliverable in a data modeling and statistics course usually asks you to describe a dataset honestly and turn the situation behind it into a conceptual and logical model, with entities named, keys chosen on purpose, and every relationship carrying a cardinality a reader can check. Read the full Assessment 1 manual.
Assessment 2
The middle deliverable in this course usually asks you to take a flat export apart normal form by normal form, naming the dependency removed at each step, then describe what is in the data with measures matched to the level of measurement rather than to habit. Read the full Assessment 2 manual.
Assessment 3
The synthesis deliverable in this course usually asks you to state a hypothesis, choose a test you can justify from the measurement level and the design, check its assumptions before you run it, report the statistic with an interval and an effect size, then say what the result means to somebody who. Read the full Assessment 3 manual.
How to actually write IT FPX 4345: where to begin
Start with the scoring guide open in one window and the data in another, and turn each criterion into a heading before you write a word. Then decide, in one sentence, what the deliverable is actually claiming, because a data paper without a claim becomes a tour of the dataset. The clusters in a course like this usually separate into describing the data honestly, modeling it, analyzing it, and interpreting the result for somebody who will not read the appendix. Settle the unit of analysis in the same breath, meaning whether one row stands for a ticket, a device, a technician, or a month, since a table that quietly mixes two units produces totals nobody can interpret and comparisons nobody can defend. Anything you produce that cannot be filed under one of those headings is decoration.
Work the modeling example all the way through once and the criterion stops being abstract. Take a service desk export with one row per ticket and columns for ticket number, date opened, technician identifier, technician name, technician extension, device serial, device model, warranty end date, and a parts column holding a comma separated list. The parts column breaks first normal form, so it becomes its own table keyed on the ticket and the part with a quantity attribute. That split makes the ticket key composite, which exposes the date opened as an attribute depending on the ticket alone, a partial dependency that second normal form pushes back into the ticket table. Technician name and extension depend on the technician identifier rather than on the ticket, and warranty end depends on the device serial, so third normal form moves both pairs into technician and device tables. Five tables come out of one spreadsheet, and every one of them can be defended by naming the dependency it protects. If you then repeat the technician name inside a reporting view to spare a join, say so, say how often the view refreshes, and say what goes wrong if a technician changes their name between refreshes.
Do the same with the statistics rather than reporting a number and moving on. Suppose 2,940 tickets were closed between the first of April and the thirtieth of June and 1,999 of them were resolved on first contact, which is a first contact resolution rate of 68 percent for that quarter, with the denominator and the window stated in the same sentence as the rate. Now compare two teams: team A resolved 71 percent of 620 tickets, team B resolved 64 percent of 2,320. A two-proportion test on those counts returns a z of roughly 3.3 and a two-sided probability below 0.01, so the seven point gap is unlikely to be noise. That is the easy half. The hard half is admitting that team A may handle password resets while team B handles hardware faults, in which case the aggregate comparison is confounded and the honest move is to stratify by ticket category before claiming anything about performance. State the confounder, show the stratified figures if the data allows, and say plainly whether seven points is worth the cost of chasing.
| Section | What goes in it | What Distinguished looks like |
|---|---|---|
| Scenario and data description | The organization, the question being answered, row counts, column definitions, and the collection window. | Every field given a data type and a meaning, with missing values counted rather than ignored. |
| Conceptual and logical model | Entities, attributes, relationships, cardinality, and the primary and foreign keys chosen. | Key choices defended, cardinality stated in business language, and optional relationships marked as such. |
| Normalization | The starting structure, the dependency removed at each step, and the resulting tables. | Each step tied to a named dependency, with any denormalization declared and justified by a read pattern. |
| Descriptive statistics | Centre, spread, distribution shape, outlier handling, and the tables that carry them. | Measures matched to the measurement level, with outlier decisions reasoned rather than automatic. |
| Inferential analysis | The hypothesis, the test, its assumptions, the statistic, the probability, and the interval. | Assumptions checked before the test runs, effect size reported, and precision expressed in problem units. |
| Interpretation and sources | What the result means operationally, what it cannot support, and current APA both ways. | Limits named without hedging the finding away, and every method traced to a citable source. |
Developing the analysis
Two settled arguments give this course something to argue about, and taking a side lifts the analysis criterion out of description. The first is whether analytic data should be normalized at all. The enterprise warehouse tradition associated with Bill Inmon builds a normalized integrated store and derives marts from it, while the dimensional tradition associated with Ralph Kimball builds fact and dimension tables around a declared grain and accepts redundancy as the price of query speed. Neither is wrong, and the deciding variable is workload: transactional systems that write constantly need the update anomalies designed out, while reporting systems that read constantly need the joins designed away. Say which workload your scenario has and the choice makes itself. The second argument is over significance testing, where the American Statistical Association's 2016 statement on p-values is the primary source to cite rather than a blog summary of it, and the point worth carrying into your paper is that a threshold of 0.05 was never meant to license a claim on its own. Report the interval and the effect alongside the probability and the criticism stops applying to you.
Citations that survive faculty review
Four families of source hold up a data paper. Method sources come first, meaning a named statistics text with its edition, the NIST and SEMATECH e-Handbook of Statistical Methods for procedure definitions, and the professional statement above for the interpretation rules, because a test you cannot attribute is a test you cannot defend. Technical standards carry the modeling claims, so cite the SQL standard by its part and year when you assert what conforming syntax does, and treat the data management body of knowledge maintained by DAMA International as the reference for stewardship and quality vocabulary. Governance sources supply the constraints, principally the NIST Privacy Framework and the de-identification guidance under the health privacy rule, which is worth naming precisely because the safe harbor route turns on removing eighteen categories of identifier while the alternative route depends on a qualified expert's determination. Peer-reviewed work retrieved through the Capella library covers everything empirical, and vendor documentation is acceptable only for describing a product's behavior, cited with its version and the date you read it. Reconcile the list against the in-text citations in both directions before submission and check that every figure in the paper appears somewhere it can be recomputed.
The mistakes that land Basic instead of Distinguished
- A rate reported without its denominator or its window. A percentage with nothing underneath it cannot be compared to anything, including itself next quarter.
- Normal forms asserted rather than demonstrated. Saying a design reaches third normal form proves nothing unless the dependency removed at each step is named.
- Correlation described in causal verbs. Words like drives, causes, and leads to commit you to a claim observational data cannot support.
- Assumption checks skipped. A test run on data that violates its assumptions produces a number, and the number is worthless.
- A table and a paragraph reporting different totals. One mismatch invites the evaluator to verify everything else, and something else will be wrong.
IT FPX 4345 questions students actually ask
Do I have to build a working database or only model one?
Your scoring guide settles it, and the verbs in the criteria are the tell, since design and diagram ask for a model while implement, create, and query ask for something that runs. When a build is required, use a free local engine on your own machine rather than anything belonging to an employer, keep the create statements and the sample inserts in an appendix, and paste the query output as text rather than describing it. When only a model is required, resist the temptation to submit a screenshot of a diagramming tool with no explanation attached, because the criterion is almost always about justification rather than draftsmanship. Name every table, state its key, and write one sentence per relationship explaining why it exists.
How do I pick the right statistical test?
Answer three questions in order and the field narrows to one or two candidates. First, what is being compared, meaning one group against a known value, two groups against each other, more than two groups, or two variables measured on the same cases. Second, what is the measurement level of the outcome, since a mean is meaningless on nominal data and a chi-square test of independence is the usual answer when both variables are categorical. Third, are the groups independent or paired, because repeated measurements on the same people need a paired procedure. Write those three answers into the paper before you name the test, and the criterion for methodological justification is already satisfied whichever test you land on.
What do I write when the result comes back non-significant?
Report it exactly as it came out and then do the work that makes it interesting. A non-significant result is not a failed assessment, it is evidence about the size of an effect, and the correct reading is that this sample could not distinguish the difference from zero rather than that no difference exists. Give the confidence interval, because a wide one around a small estimate tells the reader the study was underpowered while a narrow one around zero is a genuinely informative null. Then say what sample size would have been needed to detect an effect worth acting on, and recommend either a longer collection window or a different question. Evaluators reward that far more than a rewritten hypothesis chosen after the fact to make the numbers cooperate.
Model or analysis due this week?
Send the column list, the scenario, and the criteria. Every key gets defended, every test gets its assumptions checked, and the tables reconcile with the text. No charge on the first premium sample you request.