This manual is for IT FPX 4345 Assessment 3, start to submission. The synthesis deliverable in this course usually asks you to state a hypothesis, choose a test you can justify from the measurement level and the design, check its assumptions before you run it, report the statistic with an interval and an effect size, then say what the result means to somebody who will not open your appendix. Every criterion on your own scoring guide is marked separately, which is what the structure below is built around. What comes next is the tutor method, a section plan the criteria can score, and one annotated excerpt. Prefer to send it our way? A premium original sample for this exact assessment is returned in 24 to 48 hours, revised at no charge until it satisfies the guide. Capella's catalog lists the course as IT-FPX4345, and some courserooms print IT4345; both point to this same Assessment 3.
One honesty note before the manual: Capella revises courses and scoring guides over time, so always write to the exact scoring guide attached to your assessment in the courseroom. The course identity above is verified on capella.edu; the method and structure below are our tutors' approach to it, not Capella's official rubric text.
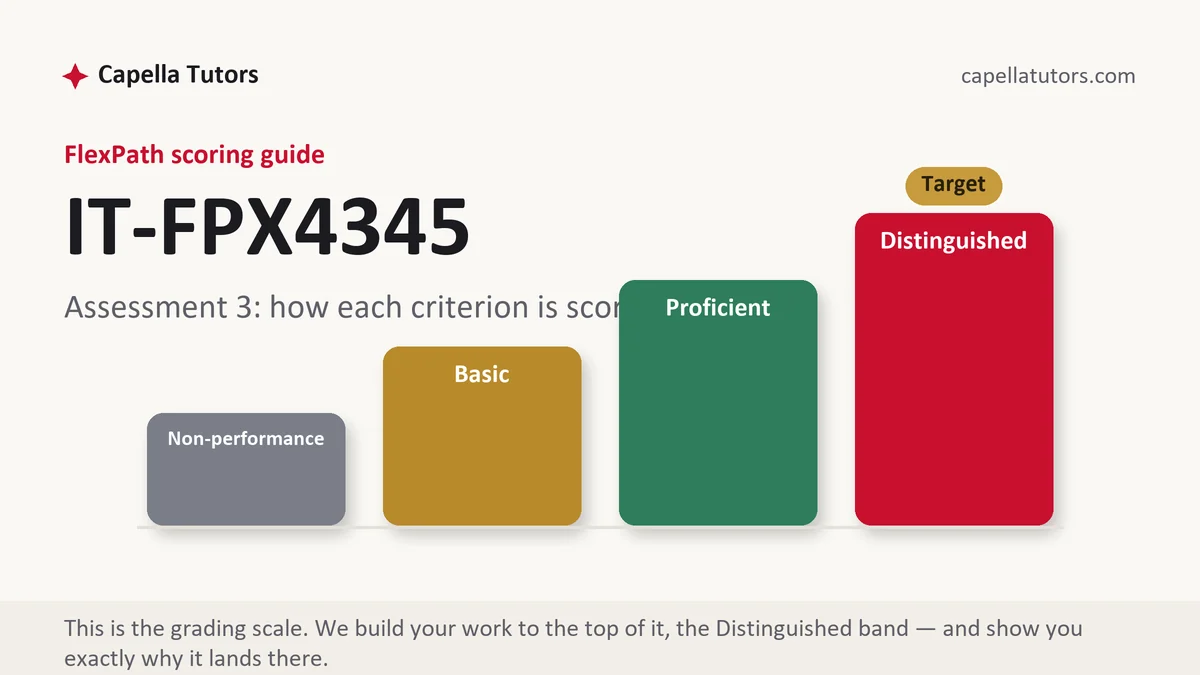
How IT FPX 4345 Assessment 3 is scored
There is no curve and no letter grade to aim at. Every criterion lands on one of four descriptors, and reading those descriptors as instructions is the whole technique:
| Level | What it means on an inferential analysis |
|---|---|
| Distinguished | The test is justified before it is run, the assumptions are checked and reported, the interval and the effect size sit beside the probability, and the interpretation names the confounder that could explain the result as well as your hypothesis does. That last move is written into the criterion. |
| Proficient | The analysis is correct and complete. The right test was run on suitable data and reported accurately, with nothing said about what could undermine it. |
| Basic | A probability reported and treated as the finding. The number is right, the reasoning that would make it mean something is absent, and a detectable difference is presented as an important one. |
| Non-performance | The hypothesis, the assumption check, or the interpretation is missing entirely, or a test appears with no stated reason for choosing it over the alternatives. |
One habit separates the top column from the one below it, and it is uncomfortable: write the sentence that argues against your own result. Naming the variable that could produce the same numbers without your explanation being true is the analysis criterion answered directly.
The IT FPX 4345 Assessment 3 method, step by step
-
Put the criteria on the page as headings, then write the question
Build the outline from the guide first, then state in one sentence what the analysis is claiming, because a data paper with no claim becomes a tour of the dataset. Say what would count as evidence for and against it, before a single test is run.
-
Write the hypotheses in the units of the problem
State the null and the alternative in the terms the organization uses, not only in symbols, so a reader can tell what is being asserted. Decide whether the question is directional and commit before you see the result, since choosing afterward turns the analysis into a story about numbers that cooperated.
-
Choose the test by answering three questions in order
What is being compared, meaning one group against a standard, two groups, more than two, or two variables on the same cases. What is the measurement level of the outcome. Are the groups independent or paired. Write those three answers into the paper before naming a procedure, and the justification criterion is satisfied whichever one you land on.
-
Check the assumptions and report the check
Independence of observations, the distributional requirement the test carries, and comparable variance where the test assumes it. Say how you checked each and what you found, including anything marginal. A test run on data that violates its assumptions still returns a number, and the number is worthless.
-
Report the statistic, the interval, and the magnitude together
Give the test statistic, the probability, a confidence interval in the units of the problem, and an effect size, then say in one sentence what that interval means for a decision. A probability alone says whether a difference is distinguishable from zero; the interval and the effect size say whether it is worth acting on.
-
Interpret against a rival explanation, then self-score
Name the variable that could produce your numbers without your hypothesis being true, then say plainly whether the difference is large enough to justify its cost. Then grade yourself against each criterion and rewrite whatever lands short of the top. Submit early, because an evaluation can occupy two business days.
A structure that maps to the criteria
The lengths below are planning figures our tutors use for a final analysis deliverable rather than Capella requirements, so shift them toward whichever criterion carries the most weight on your guide.
| Section | What it must do | Guide |
|---|---|---|
| Question and hypotheses | The decision at stake, null and alternative in the organization's own terms, direction committed in advance. | ~200 words |
| Data and preparation | Source, window, sample size, missing values, exclusions with reasons, and the unit each row represents. | ~250 words |
| Test selection and assumptions | The three selection answers, the procedure chosen, the alternatives rejected, each assumption check and result. | ~300 words |
| Results | Test statistic, probability, confidence interval in problem units, effect size, and recomputable counts. | ~250 words |
| Interpretation and limits | What the result supports, the rival explanation named, what the sample cannot settle, the recommendation. | ~350 words |
| References | Method sources by edition or version, peer-reviewed evidence, current APA matched in both directions. | as needed |
Annotated sample excerpt
An original excerpt from our team showing a result and its rival explanation inside one paragraph. Read it for the sequence.
Across 4,812 audited meter readings, the older handheld recorded a value that disagreed with the follow-up manual check in 61 of 1,940 cases, or 3.1 percent, against 143 of 2,872 cases, or 5.0 percent, for the replacement unit.1 A two-proportion test on those counts returns a statistic near 3.1 with a two-sided probability close to 0.002, and the 95 percent interval for the difference runs from roughly 0.7 to 3.0 percentage points, so the gap is unlikely to be sampling noise and is also not large.2 The comparison is nonetheless confounded, because the replacement units went to the four routes reading below-grade pit meters, and pit meters are harder to read with any device, so the honest next step is to stratify by meter location before the finding is attributed to hardware.3
- 1Gives both counts and both denominators in the same sentence as the rates, so every percentage can be recomputed without turning to an appendix.
- 2Reports statistic, probability, and interval together, and uses the interval to say the difference is real and small, a judgment a probability alone cannot carry.
- 3Names the confounder, explains the mechanism, and prescribes the stratification instead of hedging the finding away.
The full premium sample for your exact assessment, written fresh to your scoring guide and issue, is free to request. Study it, revise it into your own voice, and submit work you understand.
The five mistakes that cost Distinguished
- The probability read as the chance the null is true. It is the probability of data at least this extreme if the null held, and the two readings license completely different claims.
- Assumption checks left out of the report. An unchecked test is an unverifiable test, and the criterion asks what you checked rather than whether you knew you should.
- Correlation written in causal verbs. Drives, causes, and leads to commit you to a claim that observational data collected after the fact cannot support.
- A non-significant result treated as a failure. It is evidence about the size of an effect, and the interval plus the sample size needed is the answer the guide rewards.
- Detectability presented as importance. A difference can be unmistakable in the arithmetic and too small to justify chasing, and saying so is part of the interpretation.
Pre-submission checklist
- Null and alternative written in the organization's own units, direction fixed in advance
- The three test-selection answers appear before the procedure is named
- Every assumption check reported with its result, including anything marginal
- Statistic, probability, confidence interval, and effect size all present together
- One rival explanation named and either stratified out or acknowledged as unresolved
- Every figure recomputable from a table in the document, then self-scored before submission
Analysis and interpretation due?
Send the dataset or its column list, the question your faculty attached to it, and the scoring guide. The test comes back justified from the measurement level, the assumptions come back checked in writing, the interval sits beside the probability, and a separate reviewer recomputes every number before you see it. Delivery is 24 to 48 hours.