This manual is for IT FPX 4345 Assessment 2, start to submission. The middle deliverable in this course usually asks you to take a flat export apart normal form by normal form, naming the dependency removed at each step, then describe what is in the data with measures matched to the level of measurement rather than to habit. Both halves are scored criterion by criterion against the guide in your own courseroom. Below you will find the tutor method, a section plan tied to the criteria, and an excerpt with its moves labelled. Want this one off your desk? A premium original sample for this exact assessment lands in 24 to 48 hours and is revised free until the guide is met. Capella's catalog lists the course as IT-FPX4345, and some courserooms print IT4345; both point to this same Assessment 2.
One honesty note before the manual: Capella revises courses and scoring guides over time, so always write to the exact scoring guide attached to your assessment in the courseroom. The course identity above is verified on capella.edu; the method and structure below are our tutors' approach to it, not Capella's official rubric text.
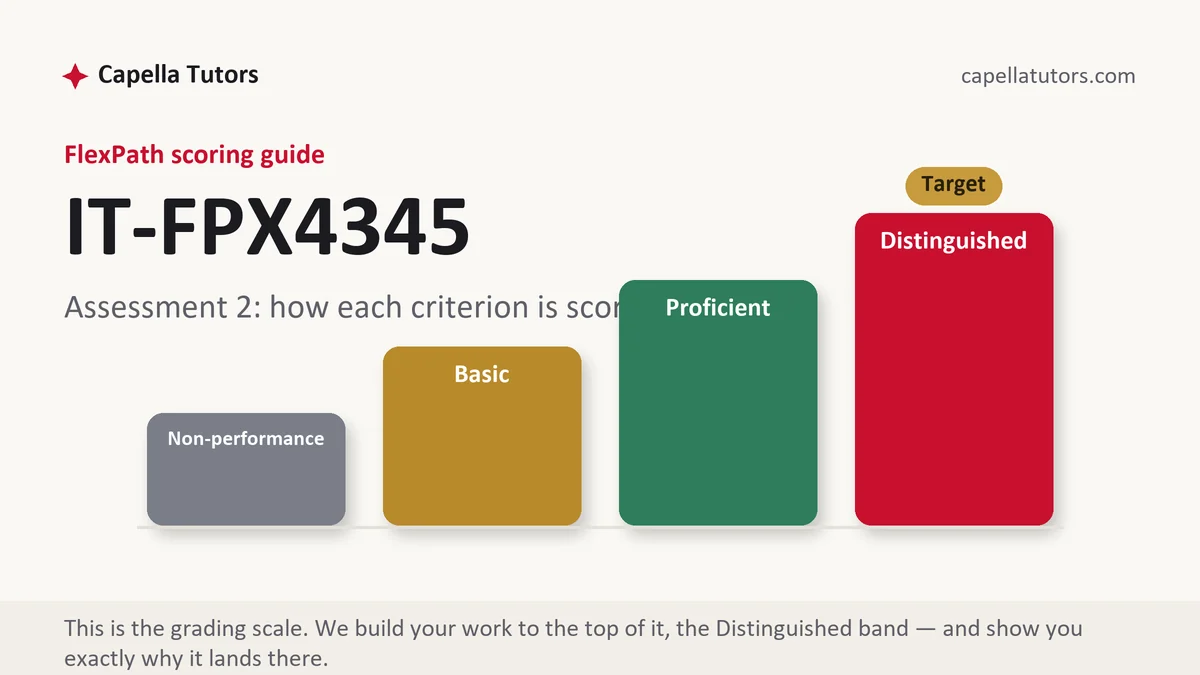
How IT FPX 4345 Assessment 2 is scored
Nothing in FlexPath resolves to a percentage or a letter. Your evaluator places each criterion at one of four levels, and those descriptions are the specification you write against:
| Level | What it means on a normalization and descriptive analysis |
|---|---|
| Distinguished | Each normalization step names the exact dependency it removed, each descriptive measure is chosen for the measurement level it sits on, and any decision to leave data denormalized or to drop a row is declared with its consequence. The criterion holds the extra move; find it and perform it. |
| Proficient | The tables reach the required form and the statistics are correct. A reader can verify the outcome but is never shown the reasoning that produced it. |
| Basic | Normal forms asserted and averages reported. The words third normal form appear, no dependency is named, and a mean turns up on a column where a mean means nothing. |
| Non-performance | A step or a measure the guide required never appears, or a set of tables is presented with no starting structure to compare it against. |
Both halves of this deliverable are graded on demonstration rather than outcome. A design that reaches the right form by accident and one that reaches it by argument look identical in a diagram and score two levels apart in prose.
The IT FPX 4345 Assessment 2 method, step by step
-
Rebuild the criteria as headings, then park the export beside them
Open the guide and the file together and give every criterion a heading before any analysis starts. Copy the top-level wording under each so the target stays visible. This is what stops a normalization paper becoming a tutorial on normal forms, because the tutorial earns nothing.
-
Photograph the starting structure before you touch it
Write down the flat table exactly as it arrived, every column in order, with one sample row shown. Normalization is graded as a journey, and a journey with no origin cannot be assessed. A dependency claim an evaluator cannot check is treated as unsupported.
-
Remove one dependency at a time and name it out loud
First normal form ends repeating groups inside a column, second removes attributes depending on part of a composite key, third removes attributes depending on another non-key attribute, and Boyce-Codd tightens the third where candidate keys overlap. State the dependency, then show the tables it produced. Four sentences of that kind outscore two paragraphs of definitions.
-
Declare any denormalization as a decision with a read pattern
If you repeat a value to spare a join, say so, say which query benefits, say how often the copy refreshes, and say what goes wrong between refreshes when the source changes. Silent redundancy reads as a mistake you missed; declared redundancy reads as engineering judgment, and one sentence separates them.
-
Match every descriptive measure to its level of measurement
Nominal data gets counts and modes, ordinal data gets medians and ranges, interval and ratio data get means and standard deviations when the distribution is roughly symmetric and medians with interquartile ranges when it is not. Report the shape before the centre, count the missing values, and give every outlier decision a stated ground.
-
Reconcile the tables against the prose, then self-score
Recompute every figure in the narrative from the table it came from, because one mismatch invites an evaluator to verify everything else. Then mark yourself on each criterion and rewrite whatever sits short of the top. Submit early in the week, since faculty have two business days to return an evaluation.
A structure that maps to the criteria
These lengths are planning targets our tutors work to on a normalization and descriptive deliverable, not Capella rules, so weight them toward whichever criterion your guide treats as heaviest.
| Section | What it must do | Guide |
|---|---|---|
| Scenario and starting table | The organization, the export as it arrived, the column list, and one sample row a reader can follow. | ~200 words |
| Normalization walk-through | Each step from the starting structure onward, the dependency removed, and the tables that resulted. | ~400 words |
| Final schema and denormalization | The finished tables with keys, plus any deliberate redundancy and the read pattern justifying it. | ~200 words |
| Descriptive statistics | Measurement level per variable, distribution shape, centre and spread, missing values, outlier decisions. | ~350 words |
| What the description supports | The questions this data can answer, the questions it cannot, and what a longer window would add. | ~150 words |
| References | Statistics text by edition, procedure references by version, current APA matched both ways. | as needed |
Annotated sample excerpt
A short original excerpt from our writers, showing what a dependency sentence looks like when it is doing its job. Study the mechanics, then run the same pass over your own export.
The rental export from the Westmoor College bookstore arrives as one row per rental with a titles column holding a comma separated list of every book on the agreement, which breaks first normal form because a single cell carries more than one value.1 Splitting that column produces a Rental Line table keyed on the rental number together with the ISBN, and the composite key immediately exposes a second problem: the pickup date and the student identifier depend on the rental number alone rather than on the pair.2 Second normal form pushes both back into the Rental table, leaving Rental Line holding only the condition grade and the due date, which genuinely depend on the agreement and the specific copy together.3
- 1Names the violation and the column that caused it in one sentence, with the definition working inside the sentence instead of sitting in front of it as a recital.
- 2Shows the split creating the composite key and then the partial dependency it revealed, which is the chain the criterion is scored on.
- 3Ends by saying what stayed behind and why it belongs there, so a reader can verify the step rather than take it on trust.
The full premium sample for your exact assessment, written fresh to your scoring guide and issue, is free to request. Study it, revise it into your own voice, and submit work you understand.
The five mistakes that cost Distinguished
- Normal forms defined instead of applied. Explaining what second normal form means earns nothing; naming the partial dependency you removed from your own table earns the criterion.
- No starting structure shown. Without the flat table the walk-through began from, an evaluator cannot confirm a single step you claim to have taken.
- A mean reported on a coded category. Averaging condition grades or department codes produces a number with no referent and signals that measurement level was never considered.
- Outliers deleted quietly. Removing extreme values with no stated reason changes who the analysis is about and hands over an easy criterion to mark down.
- Redundancy left unexplained. A repeated column with no read pattern behind it reads as an error; the same column with one sentence attached reads as a decision.
Pre-submission checklist
- The starting flat table appears in full with one sample row a reader can trace
- Every normalization step names the specific dependency it removed
- The final schema lists each table with its primary and foreign keys
- Each variable has its measurement level stated before a measure is applied
- Missing values counted per column and every outlier decision given a reason
- Every figure in the prose recomputed from its table, then self-scored before sending
Normalization walk-through due this week?
Send the export or its column list together with the criteria. Each step comes back with the dependency it removed named inside the sentence, every measure matched to its measurement level, and a separate reviewer whose only job is recomputing the numbers so the tables and the prose agree. Turnaround is 24 to 48 hours.