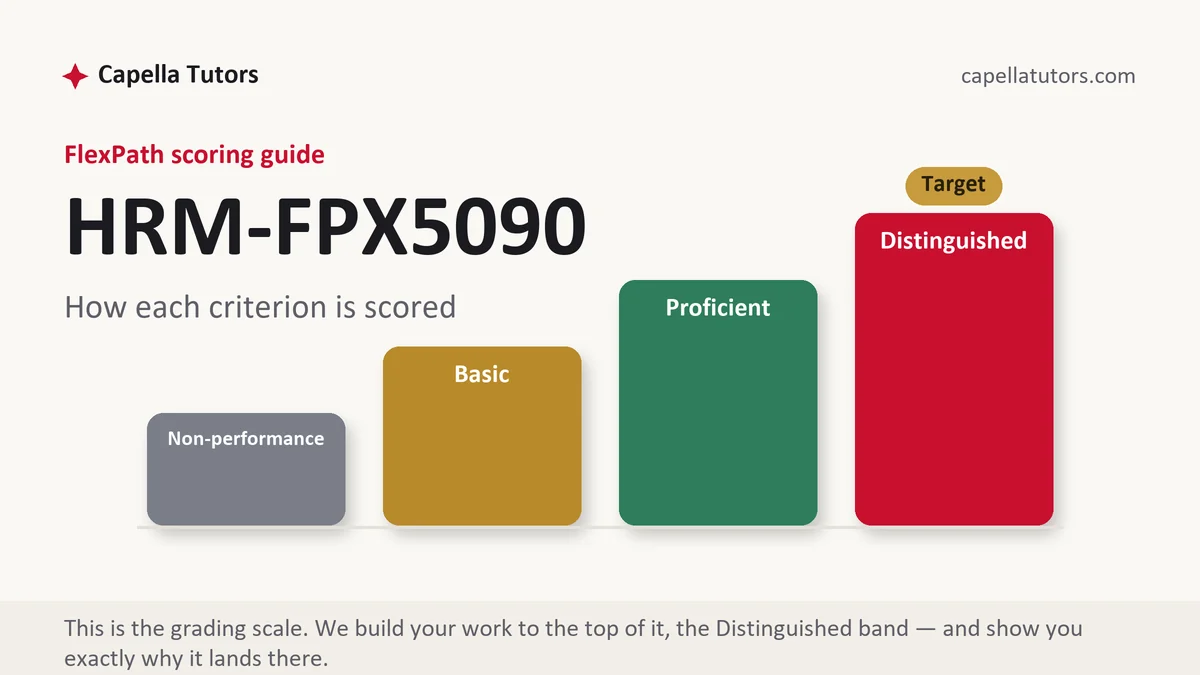
Send the assessment prompt and the scoring guide and a premium original sample returns in 24 to 48 hours, written to the Distinguished descriptors, with the turnover arithmetic checked and free revisions until the criteria are met. The transcript entry reads HRM FPX 5090, Retaining and Engaging Employees for the Modern Workforce, worth 2 program points, a core course in Capella's FlexPath MS in Human Resource Management, which concludes through the General Human Resource Management specialization or the Health Care one. In Capella's catalog the course code is written HRM-FPX5090.
What HRM FPX 5090 actually grades
Retention papers are won and lost on the first table. Total turnover is the least useful number in the file and the one most students lead with, because it mixes departures the organization chose with departures it did not, and it buries the only figure a director is genuinely accountable for. Take 34 exits in a quarter against an average headcount of 612. That is 5.6 percent for the quarter and 22.2 percent annualized, and the number stops being alarming once it is split: 13 were involuntary, 21 were voluntary, and of those 21 only 8 involved people the organization wanted to keep. Regrettable voluntary turnover is therefore running at about 5.2 percent annualized. That is the figure the paper should be about, and the criteria notice at once when a writer knows the difference.
The second strand is why people leave. The unfolding model developed by Thomas Lee and Terence Mitchell explains more of it: many departures begin with a shock, a passed-over promotion, a new supervisor, a colleague's exit, an unsolicited offer, and the shock activates a script the person may have been carrying already. Job embeddedness supplies the other half, describing how links, fit and the cost of leaving hold people in place through things unrelated to how they rate the job. In current courserooms the assessments include "HR Challenge: Engagement Study Preparation", "HR Challenge: Presentation to Leadership" and "Successful Employer Branding" among others, and your scoring guide decides the exact format of each.
Third is engagement, which the criteria treat more skeptically than most students expect. A survey of 612 employees with a 71 percent response rate produces 435 responses and a number somewhere in the seventies, and that number tells a leadership team nothing about what to change. The useful output is a driver analysis showing which items move with the outcome you care about, reported by unit and by tenure band, with small teams rolled up so no individual can be identified from a result. Then the economics. A regrettable exit at a $76,000 salary costs roughly $900 in advertising, $812 in interview time, $2,720 in onboarding and training, and around $13,300 in vacancy and ramp if you value 3.5 combined months of reduced output at 60 percent of salary. That is about $17,732 each, or $567,000 a year across 32 such exits, and the vacancy assumption is the one a CFO will push on first.
How we help in this course
Give us the exit data, the survey results and the population, and the draft comes back with the diagnosis already done. Turnover split into voluntary, involuntary and regrettable, computed on an average denominator with the window stated, broken out by tenure so the first-year problem separates from the mid-career one.
The terms are consistent across every course we cover. One premium original sample per deliverable inside 24 to 48 hours, eight people from the first search to the final read, one pass whose only job is the scoring guide, and unlimited free revision until the criteria are met. Faculty feedback returns into the cycle at no charge. Attempts sit with an evaluator for up to two business days, which is worth knowing before you promise yourself a finished course by Friday.
The assessments, one by one
Assessment 1: HR Challenge: Engagement Study Preparation
Engagement Study Preparation: a memo preparing managers for an engagement study, covering what engagement is, the employee life cycle. Read the full Assessment 1 manual.
Assessment 2: HR Challenge: Presentation to Leadership
Presentation to Leadership: present the engagement study plan to leaders, with objectives, workforce breakdown, engagement issues, goals, process, budget. Read the full Assessment 2 manual.
Assessment 3: Successful Employer Branding
A memo to leadership on the company's employer brand, its impact, negative feedback, features to market, career development and a branding and recruiting strategy. Read the full Assessment 3 manual.
How to actually write HRM FPX 5090: where to begin
Take the guide apart into headings, then start with the segmentation, because a retention problem stated at the organization level is almost always three different problems averaged together. Split the exits by tenure, by job family, by shift and by manager, and one of those cuts will usually carry most of the variance. Say which cut you used and what it revealed before you propose anything.
Then treat your evidence about causes with the suspicion it deserves. Triangulate: exit reasons, survey drivers, and what the operational data shows about workload, schedule stability and internal movement. Where the three disagree, say so and explain which one you trust.
Then design a response that fits the diagnosis rather than a list of retention practices. If the loss is concentrated in the first ninety days, the intervention sits in selection realism and onboarding, not in a recognition scheme. If it is schedule instability in an hourly workforce, the intervention is predictability, and the criteria will expect you to know that a fixed schedule posted in advance is worth real money to somebody arranging childcare.
Then price the response against the loss and set the measurement up before you start. Be conservative, because a proposal claiming to eliminate regrettable turnover will not be read past its first page, while one claiming to move it from 5.2 percent to 4.0 percent has a chance. Twelve-month cohort retention for new hires, regrettable voluntary turnover by quarter, and internal fill rate are three measures the organization can already produce, and using a report that exists is the difference between a plan that runs and a plan that gets admired.
| Section | What goes in it | What Distinguished looks like |
|---|---|---|
| The population | Headcount, composition, tenure distribution, and the units in scope. | An average denominator and a stated window, with the segments defined up front. |
| Turnover measured | Total, voluntary, involuntary and regrettable, by tenure and by segment. | The regrettable figure isolated and annualized, with the calculation shown. |
| Causes | Exit data, survey drivers, stay interviews and operational measures, compared. | Sources triangulated, with disagreements explained rather than averaged away. |
| Engagement evidence | Response rate, reporting thresholds, drivers, and what the score conceals. | Driver analysis by unit and tenure, not a single organization-wide number. |
| The intervention | What changes, for whom, what it costs to run, and the mechanism expected. | A response matched to the segment that is actually leaving, with a falsifier named. |
| Measurement and references | The metrics, the baseline, the review cadence, and current APA. | Measures the organization already reports, with a baseline captured before launch. |
Developing the analysis
The tension worth writing about is that engagement is easier to measure than to move, and that the two most reliable levers sit outside the engagement program. Pay and career progression are structural, expensive and slow, and they are frequently what a survey is quietly reporting when it shows low scores on recognition and development. The demands and resources framing developed by Evangelia Demerouti and Arnold Bakker offers a mechanism a paper can use: strain rises when the demands of the work outrun the resources available to meet them, and engagement rises when resources such as autonomy, feedback, support and a manageable load are present. That framing has the advantage of pointing at things a manager controls, and the disadvantage that much of the supporting evidence is self-reported and cross-sectional, so the same person answering both halves of a survey can manufacture part of the relationship.
Citations that survive faculty review
Three kinds of evidence belong in a retention paper. Peer-reviewed turnover and engagement research is the foundation, and the Journal of Applied Psychology, Personnel Psychology, the Academy of Management Journal and Human Resource Management carry the studies faculty recognize, reached through Business Source Complete and PsycINFO. Models are cited to their originators, so Lee and Mitchell for the unfolding model, Mitchell and Holtom for job embeddedness, Demerouti and Bakker for job demands and resources, taken from the original papers rather than a consultancy explainer. Labor market data comes from the Bureau of Labor Statistics, whose job openings and separations series lets you say whether your quit rate is unusual for your industry rather than merely unwelcome, quoted with the series and the month. Close with the current APA check in both directions.
The mistakes that land Basic instead of Distinguished
- Total turnover reported as the problem. Involuntary exits belong to a different conversation, and mixing them hides the figure that matters.
- Ending headcount used as the denominator. A growing organization looks like it is retaining people when it is only hiring faster.
- Exit interview reasons taken at face value. Pay is the safe answer to give on the way out and rarely the whole reason.
- An engagement score treated as a diagnosis. A number in the seventies tells nobody which of forty items to act on.
- A retention plan with no cost and no baseline. Without both, nobody can tell afterwards whether it worked or whether the market simply turned.
HRM FPX 5090 questions students actually ask
Is the engagement score the right thing to manage?
Manage the drivers and report the score. The composite is useful for tracking direction over time and for comparing units, and it is almost useless as an instruction because it never says what to change. Say in the paper what the score conceals, since an organization-wide seventy can contain one department at eighty-five and another at fifty-two, and the average is the only number nobody actually works in.
Exit interviews say people leave for pay. Should I believe that?
Treat it as a hypothesis and test it. Check it against evidence that does not depend on the departing employee's account. Compare the leavers' pay against your own range midpoints and against market data. See whether departures cluster under particular supervisors, on particular shifts, or inside one tenure band. Look at whether the people who left had applied for internal roles first. If your compa-ratios are low and the leavers were the lowest paid in their grade, the exit reports are probably right. If pay is competitive and the exits sit in two teams, they are not.
Do stay interviews actually change anything?
They change things when somebody acts on them and damage trust when nobody does, which is the honest answer to put in a paper. Hold them with someone other than the direct manager where that manager may be part of the problem, ask what would make the person consider leaving rather than how satisfied they are, keep them short and regular rather than annual, and aggregate the themes so no individual is identifiable. A process that collects candid answers and produces no visible change teaches a workforce not to answer candidly next time.
Retention analysis due?
Send the prompt, the guide and whatever exit or survey data you have. The first premium sample is free and the turnover split is calculated inside it.