Send the dataset description, the prompt, and the scoring guide, and a premium original sample returns inside 24 to 48 hours with the split described, a baseline to beat, and every metric shown next to the counts it was derived from. Your program plan carries this one as CSC FPX 4030, Introduction to Machine Learning, worth 3 program points, a Computer Science specialization course taken in FlexPath toward an undergraduate computing degree needing at least 90 program points, a minimum of 27 of them earned at the 3000 level or above. In Capella's catalog the course code is written CSC-FPX4030.
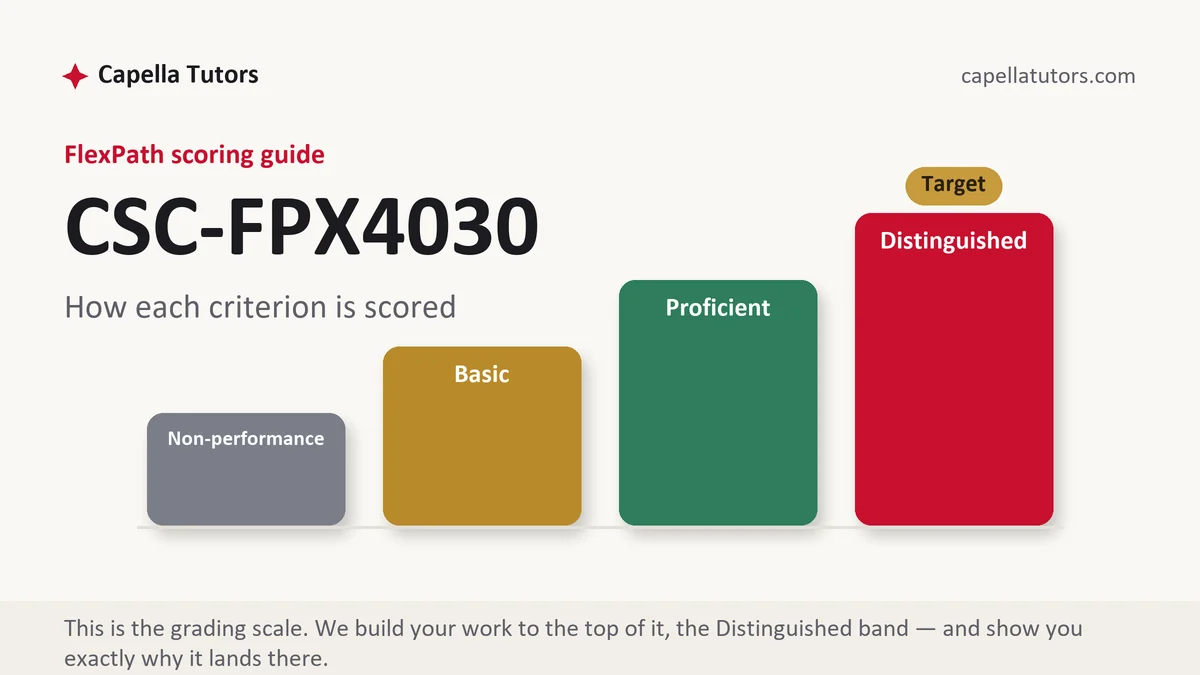
What CSC FPX 4030 actually grades
The surprise in this course is that the model is not the thing being graded. Criteria are written about method, so the same algorithm can earn Distinguished in one submission and Basic in another depending on how the rows were divided, what the result was compared against, and whether the reported numbers can be traced back to a table of counts. Faculty are checking whether you understand why a good-looking result might be an illusion. That single question shapes the whole document: how the data was partitioned, what was done to it before the partition, which metric was chosen and at what point, and whether anything from the evaluation set was allowed to influence training.
The vocabulary is standard and every term has a criterion sitting behind it. Supervised against unsupervised learning, regression against classification, features and labels, encoding categories, scaling numeric columns, partitioning into training, validation, and test sets, k-fold cross-validation, underfitting and overfitting, the trade between bias and variance, regularization, and hyperparameters tuned on validation data instead of on the test set. Metrics repay separate study, because accuracy misleads exactly when a problem is worth solving. Take ten thousand held-out rows containing two hundred genuine positives. A model that flags one hundred fifty rows and gets ninety of them right is sixty percent precise, recovers forty-five percent of the positives, scores about 0.51 on the harmonic mean of those two, and still reports 98.3 percent accuracy against a do-nothing baseline that reaches 98.0 percent by answering negative to everything it is shown.
Leakage is the failure this course is most determined to teach, and it hides inside ordinary steps. Fitting a scaler on the full table before splitting lets the held-out rows contribute their mean and spread to training. Selecting features by their correlation with the label across every row does the same thing more quietly. Duplicate records landing on both sides of the split hand the model an exam it has already seen. Time-ordered data divided at random lets a model learn from its own future. Reproducibility sits next to leakage as a graded concern: a seed fixed and reported, library versions written down, and the split preserved so somebody else can repeat the run. The last strand is the honest account of limits, meaning who the rows represent, who they leave out, and what the model should not be used to decide.
How we help in this course
Samples for this course get built in the order the criteria are scored. The problem is framed before a model is chosen, the split happens before anything is fitted, a trivial baseline is recorded so the real model has something to beat, and every metric appears with the counts behind it instead of as a lone percentage. Preprocessing is fitted on training rows and applied to the others, the seed is stated, and tuning runs on validation folds so the test partition stays sealed until the final paragraph. Send the dataset or a description of it along with the criteria, and the work is done on your data rather than on a demonstration set that makes everything look easy.
Studio terms are the same here as everywhere on the site. A deliverable lands in 24 to 48 hours, written at the Distinguished descriptor, and revisions continue free until the guide is met. Eight people touch the file, starting with research pulling your scoring guide and finishing with an editor, and the two checkpoints that decide this course are the scoring-guide reviewer who marks the draft criterion by criterion and the originality and APA pass that confirms the dataset itself has been cited properly. Returned faculty feedback re-enters the queue at no charge, which is worth using, since an attempt takes two business days to evaluate and a second one eats the week you had set aside for the next course.
The assessments, one by one
Assessment 1
Assessment 1 in CSC FPX 4030, Introduction to Machine Learning, is usually where the data gets handled before any model is allowed near it: the prediction task framed, the rows described, the split defended, and every preparation step audited for the ways it can leak. Read the full Assessment 1 manual.
Assessment 2
Assessment 2 in CSC FPX 4030, Introduction to Machine Learning, is usually where a trained model has to prove it found something: a trivial baseline to beat, a confusion matrix given as four counts, and the metrics derived in your own sentences rather than pasted from whatever a library printed. Read the full Assessment 2 manual.
Assessment 3
Assessment 3 in CSC FPX 4030, Introduction to Machine Learning, is usually the synthesis deliverable: several candidates compared on identical folds, the spread across those folds reported next to the mean, one model recommended for a stated use, and the limits of the whole exercise written by you. Read the full Assessment 3 manual.
How to actually write CSC FPX 4030: where to begin
Build the document from the criteria, then impose one rule on the analysis before anything else happens: the test partition is set aside first and is not looked at again until the final number is being reported. Everything downstream becomes honest by construction. Write the framing paragraph next, because a criterion about problem definition is asking what a prediction would be used for and what a wrong one would cost. A model that misses a fraudulent transaction and a model that blocks a legitimate customer do different damage, and naming that difference on page one hands you the metric, the threshold, and the conclusion later without any further argument.
Then report results in a form an evaluator can audit. Give the confusion matrix as four counts and derive the metrics in your own sentences rather than pasting the summary a library printed. Using the earlier figures, ninety true positives, sixty false positives, one hundred ten false negatives, and nine thousand seven hundred forty true negatives: precision is ninety over the one hundred fifty rows flagged, recall is ninety over the two hundred positives that existed, and the combined score is the harmonic mean of the pair. Now the sentence that answers the criterion becomes writable. This model finds fewer than half the positive cases and is wrong on two of every five alerts it raises, which is useful or useless depending entirely on what a person does with a flagged row next. Add the threshold discussion, since dropping the decision cutoff from one half to three tenths raises recall and lowers precision, and the correct cutoff is set by the cost of each error rather than by the default the library happened to ship.
Close with the two sections students leave out. The first is validation discipline written down: how many folds, how they were built, the mean and the spread across them, and the admission that a single fold quoted alone conceals how unstable a small dataset makes a model. Five-fold cross-validation on a thousand rows trains on eight hundred and validates on two hundred, five separate times, and a score that swings six points between folds is saying something the average is hiding. The second is the limits section. Name the population the rows came from, the period they cover, the groups too thin for the model to have learned much about, and the decision this model should not be trusted to make on its own. A criterion mentioning responsible or ethical use is asking for that paragraph and for nothing more elaborate than that.
| Section | What goes in it | What Distinguished looks like |
|---|---|---|
| Problem framing | The prediction task, the person who acts on it, and what each kind of error costs. | The metric chosen before modeling starts, justified by the cost of the two error types. |
| Data and preparation | Source, size, features, missing values, encoding, scaling, and how the split was made. | Preparation fitted on training rows only, with the split described precisely enough to repeat. |
| Baseline and models | A trivial baseline plus the candidate models and the settings each one used. | Every candidate measured against the baseline, with the hyperparameter search stated. |
| Evaluation | The confusion matrix or error figures, the metrics derived from them, and the folds. | Counts shown, metrics derived in the text, and the spread across folds reported with the mean. |
| Interpretation and limits | What the numbers mean for the decision and where the model should not be applied. | Limits volunteered by the author, including thin groups and the period the data covers. |
| Sources and format | Library documentation, dataset provenance, method sources, and current APA both ways. | The dataset cited with its collection method and terms of use, and methods traced to authors. |
Developing the analysis
The tension worth writing about is between a model that predicts well and a model a person can explain. A boosted ensemble usually beats a single decision tree on held-out data and cannot tell an affected applicant why the answer was no, while the tree offers a path of readable rules and surrenders some accuracy to do it. Neither is correct in the abstract and the criteria are not asking you to crown one. They are asking which property this use case requires. A recommendation feature can afford to be opaque, a model feeding a lending decision or a clinical follow-up cannot, and saying that converts a modeling preference into an argument. Put a number on the exchange wherever you can: the simpler model gives up three points of recall and returns a reason for every prediction it makes, and then the paper states why that exchange is or is not acceptable for the decision in front of it.
Citations that survive faculty review
The reference list on a machine learning paper has four separate jobs to do. Library documentation is the reference for what your code actually did, so a claim about a default, a solver, or a scoring function points at the user guide for the version you installed rather than at a blog post that summarized it. Methods get attributed to the people who published them, so random forests go to Breiman, support vector machines to Cortes and Vapnik, and the lasso to Tibshirani, because a criterion about theoretical grounding is checking whether you know a technique has an origin. Peer-reviewed work through the ACM Digital Library, IEEE Xplore, and the Journal of Machine Learning Research in the Capella library carries any claim about comparative performance or about a known weakness. The fourth is the one that separates careful papers from busy ones: cite the dataset. Name the repository, the collection method, the period covered, and the terms of use, since a criterion about data quality cannot be answered with a file name. Format in current APA, then audit the pairing in both directions before the file goes anywhere.
The mistakes that land Basic instead of Distinguished
- Accuracy quoted on imbalanced data. Predicting the majority class scores highly and predicts nothing at all.
- Preprocessing fitted before the split. The held-out rows helped shape the model and the score is inflated by an unknown amount.
- Tuning against the test partition. A setting chosen by looking at the test set turns it into a second training set.
- No baseline anywhere in the paper. With nothing trivial to beat, a percentage is a number without a comparison.
- One run, no seed, no versions. A result nobody can reproduce, including the person who produced it.
CSC FPX 4030 questions students actually ask
My model is 98 percent accurate. Is that good?
It depends completely on what predicting the most common class would have scored, and until that number appears in the paper the 98 means nothing. Compute the majority-class baseline first and place it beside your result in the same table. If the baseline reads 97.6 and the model reads 98.0, the model has found almost nothing and the honest sentence says exactly that. Then move to measures that notice the minority class, which are precision, recall, and their harmonic mean, and report them for each class rather than averaged into a single figure that hides the imbalance a second time. Faculty here watch for that move, and a student who volunteers the baseline before being asked has already satisfied the criterion about appropriate evaluation.
How do I choose between models when the assignment does not name one?
Pick the metric first, write it into the document, then run a short ordered comparison. Begin with something deliberately simple, a logistic regression or a shallow tree, because a simple model that performs adequately is a finding rather than an embarrassment and it gives every later candidate a reference point. Add one or two models that work differently from the first, not three variations on the same idea. Compare them on identical folds with identical preprocessing, report the mean and the spread for each, and select on the metric you named at the start instead of on whichever number came out highest. Then add a sentence saying what you would have chosen if a missed positive cost twice as much, which shows the decision was reasoned rather than fitted afterwards.
Do I need a large dataset?
No, and a small dataset you can describe completely is worth more in this course than a large one you scraped and cannot account for. The criteria care whether the split is defensible, whether the preparation was honest, and whether you understand the limits the size imposes. A few hundred rows with a documented origin, a stated collection window, and cross-validation reported with its spread will answer an evaluation criterion. What will not answer it is a large file of unknown provenance, one test score, and a closing paragraph claiming the model generalizes. State plainly how the size constrains the conclusion, and the constraint reads as judgment rather than as a weakness the evaluator had to discover.
Model trained and the write-up stalled?
Send the dataset, the criteria, and your notebook if one exists. Back comes the split, the baseline, the matrix of counts, and the interpretation that turns those counts into a scored criterion. First premium sample free.