This manual is for PM FPX 4080 Assessment 3, start to submission. These courses sit inside a business degree, so a sponsor still wants a date and a number, and this deliverable is where iterative work has to answer both honestly. The assessment usually asks you to forecast a release from observed velocity as a range rather than a date, report progress in a form somebody funding the work can act on, say what keeps the increment releasable, and plan the release itself with something you would measure afterwards. Your scoring guide decides whether that arrives as a forecast with charts, a progress report, a retrospective and release plan, or a briefing to a sponsor. The method below is the one we use, followed by a criterion-keyed structure and an annotated sample excerpt. Prefer to hand it off? A premium original sample comes back in 24 to 48 hours with the arithmetic rechecked, revised free until every criterion clears. Capella's catalog lists the course as PM-FPX4080, and some courserooms print PM4080; both point to this same Assessment 3.
One honesty note before the manual: Capella revises courses and scoring guides over time, so always write to the exact scoring guide attached to your assessment in the courseroom. The course identity above is verified on capella.edu; the method and structure below are our tutors' approach to it, not Capella's official rubric text.
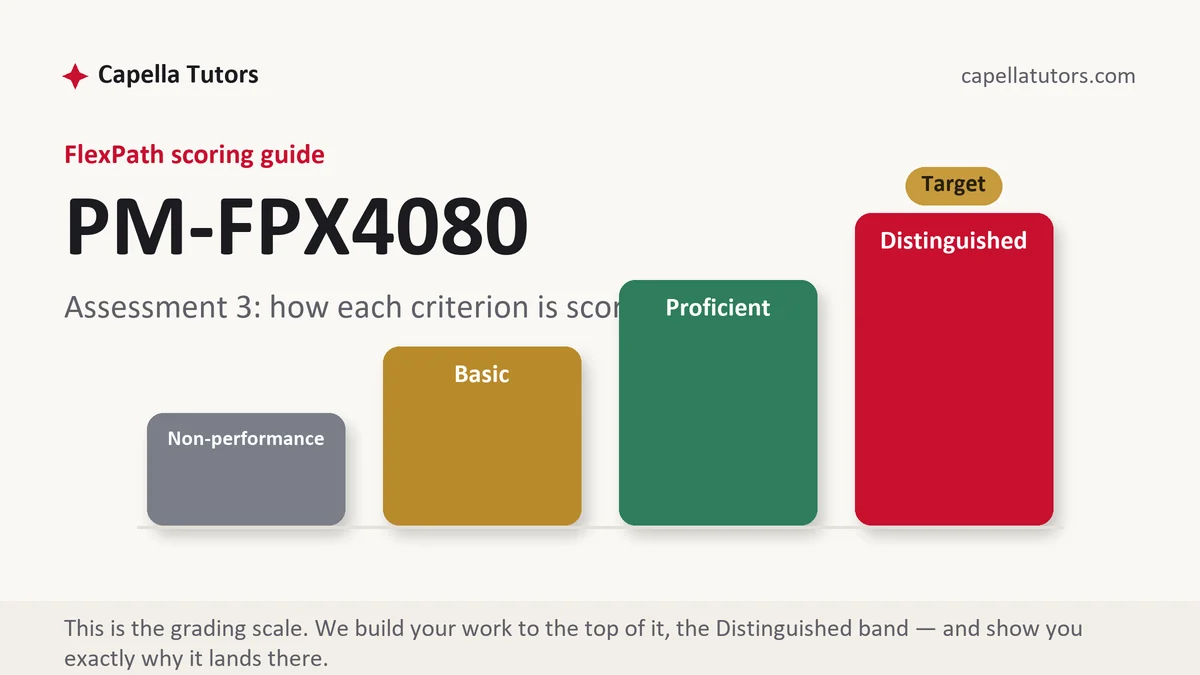
How PM FPX 4080 Assessment 3 is scored
Each criterion is graded on its own, and on a forecasting deliverable the four levels turn on whether the uncertainty survived:
| Level | What it means on a forecasting and release deliverable |
|---|---|
| Distinguished | The forecast is a range with its arithmetic shown and the conditions that would narrow it, progress is measured by accepted work, added scope is visible in the chart, and the release plan carries one measure to read afterwards. |
| Proficient | A correct forecast and clear reporting. The range is present, and nothing says what would narrow it or what happens to the numbers when scope is added. |
| Basic | A single date produced from an average velocity, with a burndown described in general terms and no mention of scope changing underneath it. |
| Non-performance | A required element is absent, usually the velocity history or the release plan, and a forecast with no observed data behind it cannot be checked at all. |
Velocity is a capacity observation rather than a productivity measure. Comparing two teams by it is meaningless, and rewarding a team for raising it produces inflated estimates within two iterations, which is worth one sentence in any paper that uses the figure.
The PM FPX 4080 Assessment 3 method, step by step
-
Forecast from observed rates, three ways
Take five completed iterations delivering 18, 24, 21, 27 and 20 points, an average of 22. With 264 points remaining, the average says twelve more iterations, the slowest observed rate says fifteen and the fastest says ten, so at two weeks each the honest forecast is twenty to thirty weeks with twenty-four as the planning number.
-
Say what would narrow the range
A stable team, scope removed from the release, or two more iterations of data. Naming the conditions turns a range from a hedge into a forecast, and it gives the sponsor something to buy if they want the estimate tightened.
-
Translate progress into money if the sponsor thinks in budgets
Earned value works once you agree what counts as earned. A release budget of 297,000 dollars over a 330-point backlog prices a point at 900 for planning; after five iterations 110 accepted points is 99,000 earned against an actual cost of 121,000, a cost index of 0.82 trending the release toward about 363,000.
-
State the two cautions in the same paragraph
Points are relative rather than absolute, so the price per point drifts as a team calibrates, and scope added mid-release changes the denominator. Reporting the index and then naming both cautions is the interpretive work the top column is asking for.
-
Choose the chart that shows scope moving
A burnup plots completed work against a total scope line, so when scope rises the reader sees added work rather than a slowing team, which is exactly the distinction a sponsor needs. Say where the numbers came from, then interpret the picture: name the iteration where the gap opened and the cause from your own scenario.
-
Plan the release and one measure afterwards, then submit
What is trained, who supports it, what the rollback is, and which measure you will read two weeks after go live to know whether the thing was worth building. Retrospectives count only where they produce a few changes with owners. Then self-score against each descriptor and submit while a second attempt still fits.
A structure that maps to the criteria
Ranges our tutors use for a forecasting deliverable with reporting and release sections; where the guide asks for charts with commentary, the interpretation grows and the release plan shrinks.
| Section | What it must do | Guide |
|---|---|---|
| Velocity history | The completed iterations, what was accepted in each, and any event that explains an outlier. | ~200 words |
| Forecast | Remaining work, the three rates, the resulting range, the planning figure, and what would narrow it. | ~300 words |
| Reporting for a sponsor | Progress by accepted work, the index if the guide wants one, and the two cautions that go with it. | ~300 words |
| Charts | The chart chosen, its axes, where the data came from, and the reading you take from it. | ~250 words |
| Technical quality | What keeps the increment releasable, how defects are handled, and the cost of deferring either. | ~200 words |
| Retrospective, release and references | Improvements with owners, the release plan, the post-release measure, current APA both ways. | ~250 words |
Annotated sample excerpt
A forecast paragraph from an original model our team wrote, printed as the sponsor would receive it.
Five completed iterations delivered 18, 24, 21, 27 and 20 points, an average of 22, and 264 points remain in the release backlog.1 At the average that is twelve more iterations, at the slowest observed rate fifteen and at the fastest ten, so with two-week iterations the forecast is twenty to thirty weeks and twenty-four is the figure we are planning against; the range narrows if the team stays intact, if the meter-history screens come out of this release, or after two more iterations of data.2 Priced for the finance committee, the 297,000 dollar release budget across a 330-point backlog values a point at 900 for planning purposes, so 110 accepted points is 99,000 dollars earned against 121,000 spent, a cost index of 0.82 trending toward roughly 363,000, with the caution that points drift as the team calibrates and that any scope added changes the denominator this figure rests on.3
- 1The observed data printed before any forecast, so a reader can compute the three rates independently.
- 2Three rates, a range, a planning figure and the conditions that would narrow it. The uncertainty is shown rather than averaged away.
- 3The translation into money with both cautions in the same paragraph, which is the interpretive move the top descriptor is describing.
The full premium sample for your exact assessment, written fresh to your scoring guide and issue, is free to request. Study it, revise it into your own voice, and submit work you understand.
The five mistakes that cost Distinguished
- A single date forecast from an average. Reporting one finish date from one average discards the range that made the technique worth using.
- Velocity presented as a productivity target. It measures what this team completes in an iteration, and turning it into a goal inflates estimates rather than output.
- A burndown where scope is changing. A chart counting only work remaining hides added scope and makes a growing release look like a slowing team.
- An index quoted with no cautions. Points drift and scope moves, so a cost index reported as a hard figure overstates what the arithmetic can support.
- Reviews and retrospectives merged. One inspects the product with the people who wanted it and the other inspects the way of working, and combining them loses both.
Pre-submission checklist
- Velocity history printed, with any outlier explained
- A forecast given as a range from three observed rates, with the arithmetic shown
- The conditions that would narrow the range named
- Progress measured by accepted work, with both cautions stated if an index is used
- A chart that makes added scope visible, interpreted rather than described
- Improvements with owners and a post-release measure named, self-scored, submitted early in the week
Release forecast or progress report due?
Send the velocity history, the backlog and the criteria. We forecast as a range with the arithmetic in view, price it for a finance reader and return a premium original sample inside 24 to 48 hours.