This manual is for PM FPX 4000 Assessment 3, start to submission. This is the deliverable with arithmetic an evaluator can check, which makes it the easiest one to score well and the easiest one to fail quietly. The assessment usually asks you to measure a project in progress, convert the variances into indices, forecast the finish, and then handle the uncertainty around your own numbers as a set of decisions rather than a list of worries. Your scoring guide decides whether that arrives as a performance report, a measurement section inside a larger plan, or a briefing that asks a sponsor to approve something. The method below is our tutors' approach, with a criterion-mapped structure and an annotated sample excerpt. Prefer to hand it off? A premium original sample returns in 24 to 48 hours with every figure recomputed by a second reader. Capella's catalog lists the course as PM-FPX4000, and some courserooms print PM4000; both point to this same Assessment 3.
One honesty note before the manual: Capella revises courses and scoring guides over time, so always write to the exact scoring guide attached to your assessment in the courseroom. The course identity above is verified on capella.edu; the method and structure below are our tutors' approach to it, not Capella's official rubric text.
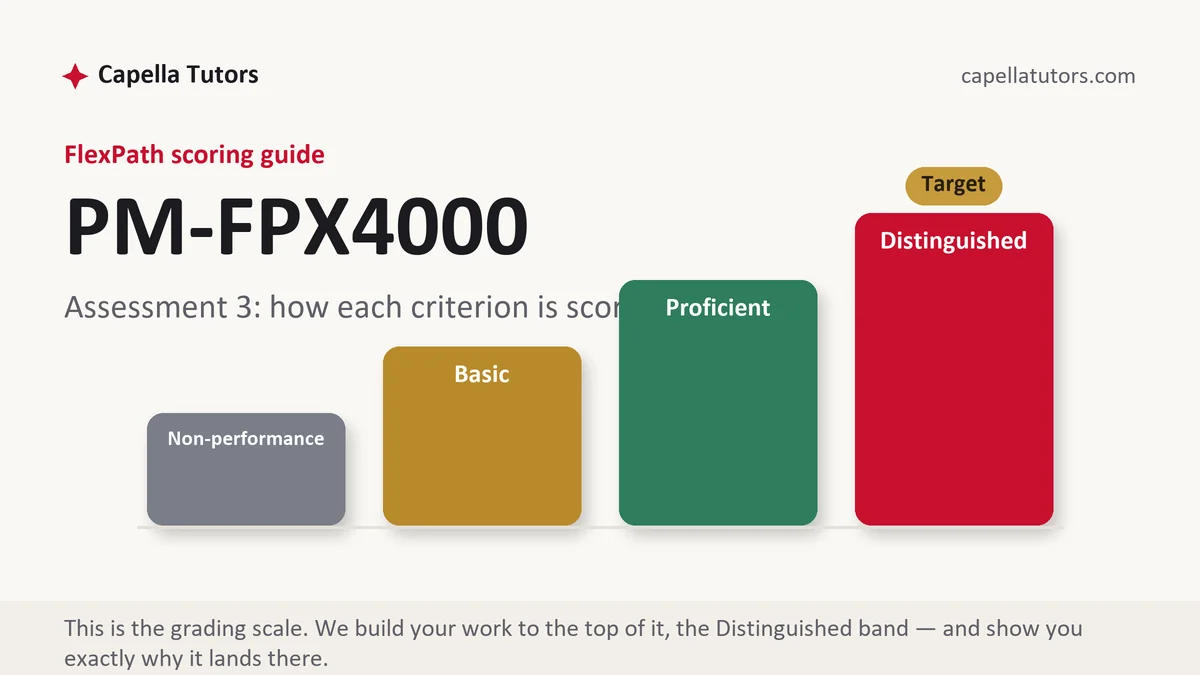
How PM FPX 4000 Assessment 3 is scored
Criteria are graded one by one, and where the answer is numeric the four levels stop being a matter of style:
| Level | What it means on a measurement and uncertainty analysis |
|---|---|
| Distinguished | The indices are computed and then translated, the forecast follows from them, a named action is recommended, and the exposure on at least one uncertainty is priced against what the response would cost. |
| Proficient | The variances and indices are correct and clearly presented. The reader is told what the numbers are and left to work out what to do about them. |
| Basic | Two dollar figures reported as a variance table with no indices and no forecast, which describes the past to a sponsor asking about the finish. |
| Non-performance | A required calculation is absent, or risk appears as an unpriced list with no owners, which leaves the uncertainty criterion nothing to grade. |
Variances describe what has happened and indices describe the rate it is happening at, which is why the forecast has to come from the index. A sponsor cannot act on a number about last month, and every criterion in this part of the course is written from the sponsor's side of the table.
The PM FPX 4000 Assessment 3 method, step by step
-
Name the three inputs before computing anything
Planned value is what the schedule said would be finished by now, earned value is what has actually been finished priced at plan rates, and actual cost is what has been spent. Write all three with the date they were measured on. Most wrong answers in this deliverable are not arithmetic errors, they are earned value confused with money spent.
-
Convert both variances into indices
A variance in dollars is a fact about the past and an index is a rate you can project. Earned over actual gives the cost index, earned over planned gives the schedule index, and both belong in the paper as figures to two decimal places with a sentence saying what each one buys.
-
Forecast, then say what you would do
Dividing the budget by the cost index gives the finish if performance holds, and that assumption should be stated rather than hidden. Then name which index you would attack first and what you want the sponsor to approve, because a forecast with no request attached is a report and the criterion asks for management.
-
Rank the uncertainties by exposure, not by worry
Order the threats by probability multiplied by cost so a reader can see which ones justify spending money. Put a real figure on at least one: a supplier slipping a fortnight on a path with no slack costs whatever a fortnight of the crew costs, and that figure is what tells you what a second supplier is worth.
-
Fund some, accept some, say which
Name the opportunities you would chase as well as the threats you would spend on, and be explicit when you accept something deliberately. A response that costs more than the loss it removes is a loss, and a paper that never accepts a risk has not weighed one against its price.
-
Test one assumption to destruction, then submit
Take the assumption your forecast most depends on, move it, and show the plan still works or say what you would change. Then recompute every figure from the inputs without looking at the draft, match the prose to the tables, and submit early enough to leave room for a second attempt.
A structure that maps to the criteria
Ranges our tutors use for a measurement deliverable with an uncertainty section; where the guide asks for a sponsor briefing, the interpretation grows and the tables stay as they are.
| Section | What it must do | Guide |
|---|---|---|
| Baseline and measurement basis | The budget, the period measured, how earned value is credited, and the reporting cadence. | ~200 words |
| Position at the reporting date | Planned value, earned value and actual cost with their variances, presented as a short table. | ~200 words |
| Indices and forecast | Both indices computed, the forecast at completion, and the assumption the forecast rests on. | ~250 words |
| Interpretation and recommendation | What the figures mean for the finish, the decision required, and the date it stops being useful. | ~250 words |
| Uncertainty and response | Threats and opportunities ranked by exposure, responses priced, deliberate acceptances named. | ~300 words |
| Assumptions and references | Every constructed figure declared, empirical claims cited to journals, current APA both ways. | as needed |
Annotated sample excerpt
A worked position paragraph from an original model our team wrote, printed the way a measurement section should read.
The build carries a budget at completion of 180,000 dollars across ten weeks; at the end of week six the plan called for 105,000 dollars of work finished, the work actually finished is valued at 90,000, and 108,000 has been spent.1 Cost variance is therefore 18,000 unfavorable and schedule variance 15,000 behind, which converts to a cost index of 0.83 and a schedule index of 0.86, so every dollar leaving the account is buying 83 cents of stage, fencing and power.2 Dividing the budget by the cost index forecasts a finish near 216,000 dollars, an overrun of about 36,000 if the rate holds, and the decision the sponsor owes us this week is whether to fund that gap or drop the second stage from the opening night.3
- 1All three inputs printed with the measurement date, so a reader can verify every later figure without asking where it came from.
- 2The indices translated into plain terms in the same sentence they are computed. A rate with a meaning attached is what the interpretation criterion pays for.
- 3The forecast turned into a request with two named options. A sponsor can act on this paragraph, which is the difference between reporting and managing.
The full premium sample for your exact assessment, written fresh to your scoring guide and issue, is free to request. Study it, revise it into your own voice, and submit work you understand.
The five mistakes that cost Distinguished
- Earned value taken as money spent. Crediting the budget for work in progress rather than for work finished corrupts both indices and every figure downstream of them.
- Variances reported with no indices. Two dollar figures describe last month, and the criterion is asking what the finish now looks like.
- A forecast with no assumption stated. Projecting the current rate to completion is a legitimate method and a strong claim, so the condition it depends on has to be written down.
- Risk as an unpriced list. Threats with no probability, no cost and no owner cannot be ranked, and the uncertainty criterion is asking for the ranking.
- Mitigation attached to everything. Spending more on a response than the expected loss it removes is a loss, and no deliberate acceptance anywhere means nothing was weighed.
Pre-submission checklist
- Planned value, earned value and actual cost stated with the measurement date
- Both variances and both indices computed and shown to two decimal places
- A forecast at completion with the assumption behind it written down
- A named decision for the sponsor, with options and a date it expires
- Threats and opportunities ranked by exposure, at least one priced against its response
- Every figure recomputed from the inputs, prose matched to tables, submitted early in the week
Performance report or uncertainty analysis due?
Send the figures the scenario supplies and the criteria. We compute both indices, forecast the finish, price the exposure and hand back a premium original sample inside 24 to 48 hours with a second reader's arithmetic behind every number.