This manual is for HRM FPX 5080 Assessment 2, start to submission. Where the earlier work in this course interrogates published research, the middle deliverable turns the same suspicion on your employer's own numbers, so the assessment usually asks you to audit an internal measure, establish its definition, denominator and provenance, and recompute a headline claim from the underlying counts. The case worked below is a compressed four day schedule pilot in a public utility's customer operations division. Want the audit done for you? One premium original deliverable, with the arithmetic checked by a second reader, returns in 24 to 48 hours and free revisions come attached. Capella's catalog lists the course as HRM-FPX5080, and some courserooms print HRM5080; both point to this same Assessment 2.
One honesty note before the manual: Capella revises courses and scoring guides over time, so always write to the exact scoring guide attached to your assessment in the courseroom. The course identity above is verified on capella.edu; the method and structure below are our tutors' approach to it, not Capella's official rubric text.
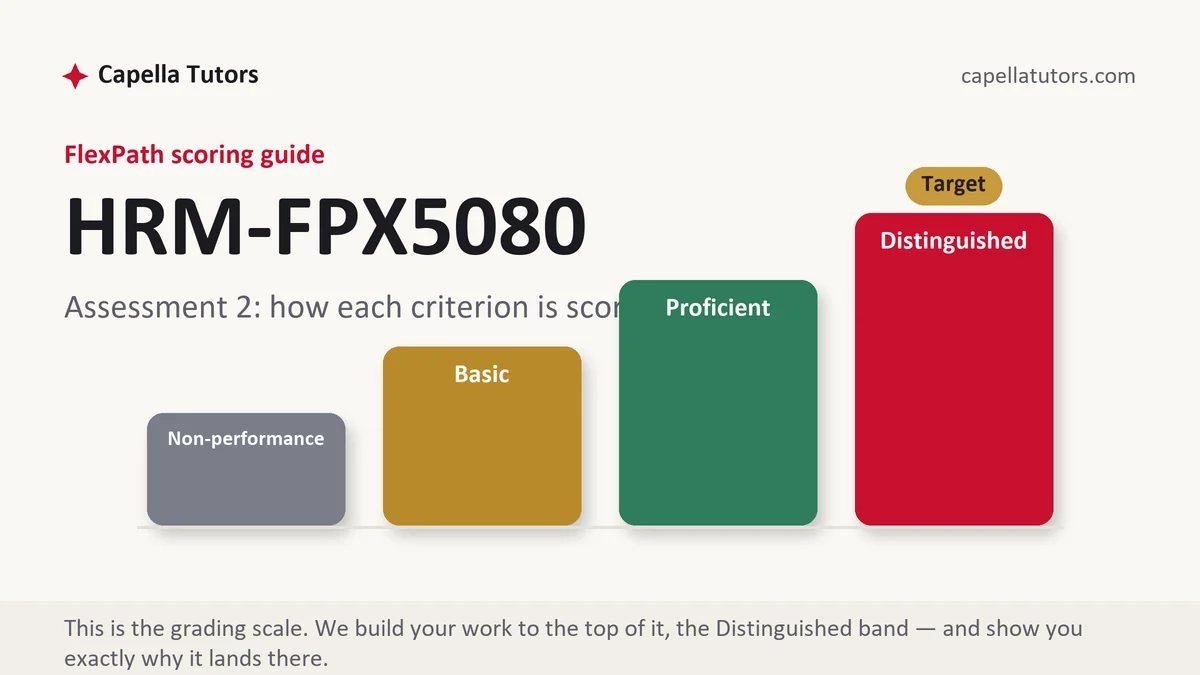
How HRM FPX 5080 Assessment 2 is scored
Four levels, one criterion at a time, and the descriptor language tells you precisely what evidence the evaluator is looking for:
| Level | What it means on an internal data analysis |
|---|---|
| Distinguished | Every measure defined in writing, denominators reconstructed by the writer, the entry incentive behind the data examined, and the headline claim recomputed from raw counts even when the recomputation is unwelcome. |
| Proficient | The data is described accurately, the arithmetic is right, and the limitations are acknowledged. Nothing has been rebuilt from underneath. |
| Basic | The organization's reported figures repeated in the writer's own prose. Faithful, uncritical, and the most common landing spot in this deliverable. |
| Non-performance | Rates quoted with no denominator or window stated, which leaves the analysis criteria with numbers that cannot be checked. |
The reason this deliverable rewards suspicion is that internal HR data is a byproduct of administration rather than a research instrument. Nobody built the timekeeping system to answer your question, and every field in it was entered by somebody with a deadline.
The HRM FPX 5080 Assessment 2 method, step by step
-
Get the definition in writing before you look at the number
Ask what counts as a case, when the clock starts, what closes it and what is excluded. Then check whether that definition held for the whole period, because a measure redefined mid-pilot produces a trend the organization never actually had.
-
Rebuild the denominator with your own hands
Productivity per scheduled hour and productivity per staffed hour are different measures, and a schedule change moves one of them without anyone working differently. Use the average across the period rather than a snapshot at the end, and state which you used in the sentence that reports the result.
-
Ask who entered the record and what it was worth to them
Provenance is part of appraisal. A closure code selected by the person whose queue is being measured is not a neutral observation, and a batch routine that clears dormant records is not work performed. Name the entry path for every field you rely on.
-
Recompute the headline claim from raw counts
The pilot reported 8.4 percent higher throughput: 7,905 cases over 10,608 staffed hours, or 0.745 per hour, against a baseline of 8,412 cases over 12,240 hours, or 0.687. Strip the 1,190 records cleared by the batch-close routine enabled in week five and the post figure becomes 6,715 over 10,608, or 0.633 per hour, which is 7.9 percent below baseline rather than above it.
-
Hunt for the cost line the report left out
Compressed coverage pushed Friday demand onto an on-call rotation, so overtime rose from 410 hours to 968 across the twelve weeks, and at a time and a half rate of 47.25 dollars that is 45,738 dollars against 19,373 dollars, an increase of 26,365 dollars in a quarter or roughly 114,250 dollars annualized. A pilot evaluation with no overtime line has not been evaluated.
-
Say what the data quality permits you to conclude, then self-score
Bad data is a finding, not a reason to change topic. Work with the subset that holds, state the limit it places on the conclusion, and recommend the definition fix that would make the next pilot readable. Then mark each criterion D, P, B or N yourself and rework anything under D.
A structure that maps to the criteria
These proportions are our tutors' planning shape rather than Capella instructions, so redistribute them wherever your own guide gives a section its own criterion.
| Section | What it must do | Guide word target |
|---|---|---|
| The claim under audit | What the organization reported, who reported it, and what decision now rests on the figure. | ~175 words |
| Measure definitions | Each metric defined operationally, with the date of any definition change and its effect on comparability. | ~225 words |
| Denominators and windows | The base you used, why an average beats a snapshot, and the window both periods cover. | ~225 words |
| Provenance | Who entered each field, under what pressure, and which records were generated by a system rather than by work. | ~250 words |
| Recomputation | The headline claim rebuilt from raw counts, with the arithmetic shown line by line and the result stated plainly. | ~300 words |
| Omitted costs and references | The lines the original evaluation missed, the limits on your conclusion, and current APA matched both ways. | ~250 words |
Annotated sample excerpt
Here is a passage our team wrote to show how a recomputation should read when the answer contradicts the sponsor. Take the sequence of moves and apply them to your own figures.
The reported gain rests on a numerator that changed composition in week five, when a batch-close routine was enabled to clear records dormant for more than 90 days and 1,190 such closures entered the pilot period as completed cases.1 Recomputing throughput on staffed hours rather than scheduled hours, and excluding system-generated closures from both periods, gives 0.633 cases per staffed hour during the pilot against 0.687 before it, a decline of 7.9 percent rather than the reported 8.4 percent improvement.2 This does not establish that the schedule reduced output, because the batch routine and the pilot began three weeks apart and the fourth quarter carries a seasonal billing surge that the baseline window does not, so the defensible conclusion is that the pilot data cannot support a productivity claim in either direction and that a clean comparison requires a fixed definition held across both windows.3
- 1Identifies the contamination and dates it. A numerator that changed composition mid-period is the single most common defect in pilot reporting.
- 2Shows both figures on a consistent basis so the reader can see the reversal rather than take it on trust.
- 3Declines to overclaim in the opposite direction. Refusing your own convenient conclusion is what the top of the guide is describing.
The full premium sample for your exact assessment, written fresh to your scoring guide and issue, is free to request. Study it, revise it into your own voice, and submit work you understand.
The five mistakes that cost Distinguished
- The company's figure repeated rather than rebuilt. An analysis that accepts the reported number has audited nothing, whatever else it does well.
- A rate with a shifting base. Comparing two periods whose denominators were built differently produces a movement that exists only in the arithmetic.
- System activity counted as work. Automated closures, bulk updates and migration artifacts inflate throughput and are invisible unless you go looking.
- Data entry treated as neutral. Fields completed by the person being measured carry an incentive, and the incentive belongs in the appraisal.
- Costs the pilot created left uncounted. Overtime, backfill and rework are where a scheduling change usually spends the savings it claims.
Pre-submission checklist
- Each criterion on the guide is answered under its own labeled heading
- Every measure carries a written operational definition and any change is dated
- Denominators reconstructed on an average basis, with the window stated for both periods
- The entry path and incentive named for each field the analysis depends on
- The headline claim recomputed from raw counts with the arithmetic visible
- Omitted cost lines added, limits stated, current APA matched, every criterion self-scored D
Want this assessment done with backup?
Send the scoring guide and whatever internal report you are allowed to share, with the identifiers stripped. A team of eight, including a research analyst and two QA reviewers, returns a premium original sample written to the Distinguished column in 24 to 48 hours, with revisions until it gets there. The denominators are rebuilt from the counts, and if the claim does not survive, the draft says so.