This manual is for HRM FPX 5002 Assessment 1, start to submission. Assessment 1 of HRM FPX 5002, Survey of Human Resource Management in Practice, is where the function stops being a list of departments and becomes one system on paper. The assessment usually asks you to describe a real organization, map its human resource function, and show how the parts depend on each other. Below is the method our tutors use, a structure that maps to the criteria, and an annotated sample excerpt. Prefer to hand it off? A premium original sample for this exact assessment comes back in 24 to 48 hours, revised free until it meets the guide. Capella's catalog lists the course as HRM-FPX5002, and some courserooms print HRM5002; both point to this same Assessment 1.
One honesty note before the manual: Capella revises courses and scoring guides over time, so always write to the exact scoring guide attached to your assessment in the courseroom. The course identity above is verified on capella.edu; the method and structure below are our tutors' approach to it, not Capella's official rubric text.
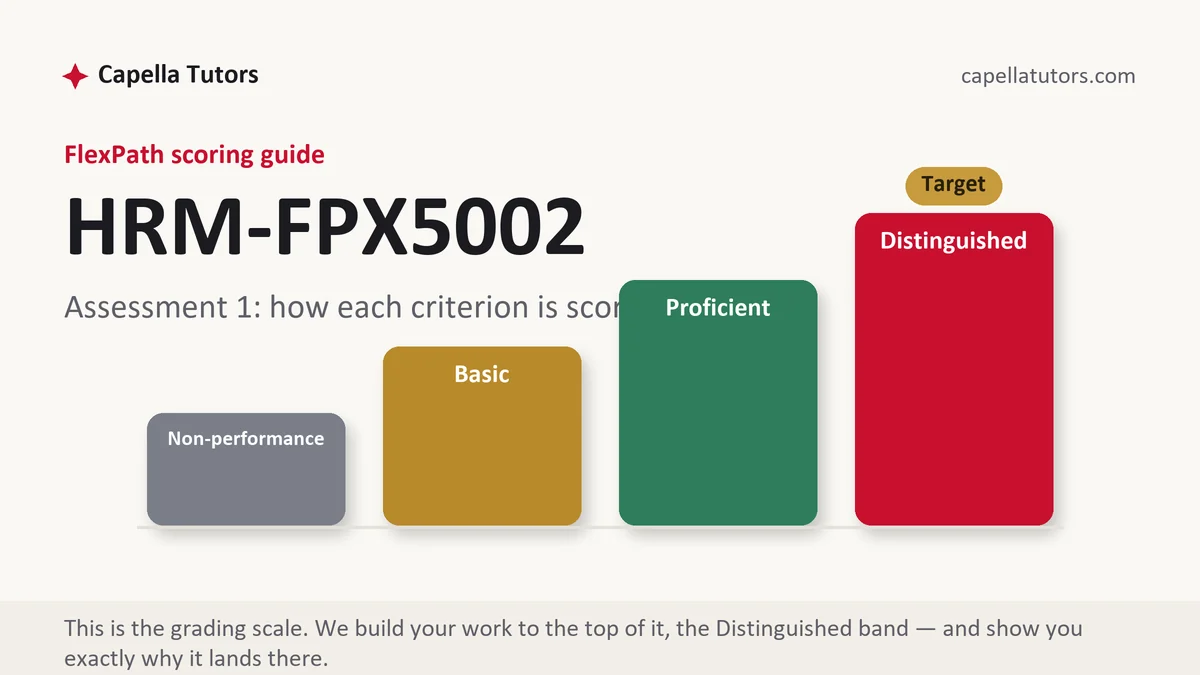
How HRM FPX 5002 Assessment 1 is scored
FlexPath issues no letter grades. Your scoring guide sorts every criterion into one of four bands, and the wording inside each band is the specification for the writing:
| Level | What it means on a function analysis |
|---|---|
| Distinguished | The function is drawn as a system with its handoffs named, and at least one dependency is traced out of the area that created it and into the area that pays for it. Measurement appears as arithmetic with its denominator stated. |
| Proficient | Every area is described accurately and connected to the organization's objective. Complete work, and one traced consequence short of the top of the guide. |
| Basic | Six competent paragraphs about six functional areas, arranged side by side, with nothing moving between them. This is where most first drafts of a survey analysis land. |
| Non-performance | A required element is missing outright, most often the organizational description that the rest of the analysis is supposed to rest on. Absent scores lower than weak. |
The joins carry the points for a practical reason. An organization does not experience staffing, rewards and employee relations as separate services, it experiences one decision arriving late in three places at once, and a graduate analysis is expected to read the function the way it is actually felt.
The HRM FPX 5002 Assessment 1 method, step by step
-
Turn the scoring guide into your outline before you write
Number the criteria, make each one a heading, and paste the Distinguished wording underneath it in brackets you delete at the end. Any paragraph that will not file under a heading is writing you did for your own satisfaction. In a survey analysis the criteria usually cluster into four jobs: describe the organization, map the function, connect it to strategy, and defend a measure.
-
Pick an organization you can describe in figures
Sector, approximate size, number of sites, salaried against hourly, represented or not, and how the human resource work is arranged between a centre and the field. Adjectives are free and prove nothing. A structure described precisely enough that the problem you later identify could only happen there is the specificity the top column is looking for.
-
Count capacity twice, in people and in purchased hours
Headcount answers how many people the employer is responsible for. Full-time equivalents answer how much labour the employer bought. In a seasonal business the two diverge violently, and a reader who sees only one of them cannot judge whether the function is under-resourced. Show the conversion on the page rather than announcing the result.
-
Draw the map as flows, not as boxes
For each area, write one sentence on what it produces and one on who receives it. Recruiting produces an accepted offer that onboarding receives. Compensation produces a grade that the requisition receives before it posts. When you can name the receiver for every output, the dependencies write themselves and the analysis stops reading like an organizational chart with captions.
-
Trace one decision all the way through
Choose a single decision the organization actually made, then follow it. A hiring freeze holds three requisitions, which raises overtime in the receiving department, which shifts the training calendar, which surfaces as a scheduling grievance a quarter later. One decision followed to its fourth consequence demonstrates the systems criterion better than six areas described well.
-
Self-score, then check the arithmetic separately
Work through the draft one criterion at a time and award yourself a level on each, honestly. Then give the numbers a pass of their own, because a total in the narrative that disagrees with the table costs you a reader you cannot get back. Faculty are allowed two business days to evaluate, so submit early in the week.
A structure that maps to the criteria
The lengths below are our tutors' planning figures for a survey analysis at this level, not Capella rules. Push any section your own scoring guide weights harder.
| Section | What it must do | Guide |
|---|---|---|
| Introduction and organization | Name the sector, size, sites, workforce composition and how the function is arranged, then state what the analysis will show. | ~200 words |
| The function mapped | Each area in scope, what it produces, and which area receives that output. Handoffs named, not implied. | ~350 words |
| Strategy alignment | The business objective in the organization's own terms, and the practices that carry it or obstruct it. | ~300 words |
| Measurement | Two or three figures with formula, denominator, period and source, compared against something outside the building. | ~250 words |
| Dependency traced | One decision followed through the functions it touches, with the cost or delay it created at each stop. | ~250 words |
| Conclusion and references | What the map reveals, what it cannot see, and current APA matched in both directions. | ~150 words |
Annotated sample excerpt
An original model excerpt from our team, showing the register that scores at the top of the guide. It is study material: learn the moves, then write your own version.
The cooperative carries 118 year-round employees and adds roughly 260 seasonal packers for the nine-week harvest, each averaging 31 hours a week.1 Those seasonal hours total 72,540 across the season, which converts to 34.9 full-time equivalents on a 2,080 hour year, so the cooperative employs as many as 378 people at peak while purchasing 152.9 FTE of labour annually.2 Against 152.9 FTE the 2.5 FTE human resource team is 1.64 staff per 100 employees, close to the published norm for employers of this size; against the 378 people on site in September it is 0.66, and the second figure is the one the packing floor experiences.3
- 1Establishes the workforce with counts and an average, so every later figure has a visible origin. No adjective is doing arithmetic here.
- 2Shows the conversion rather than reporting its result. An evaluator can reproduce 72,540 divided by 2,080, and reproducible is what defensible means at this level.
- 3Gives the same ratio two denominators and says which one matches lived experience. Naming the limit of your own measure is the move that separates the top column from a competent one.
The full premium sample for your exact assessment, written fresh to your scoring guide and issue, is free to request. Study it, revise it into your own voice, and submit work you understand.
The five mistakes that cost Distinguished
- Six essays in a trench coat. Areas described one after another with no output crossing between them answers the syllabus and misses the criterion.
- Strategy asserted rather than traced. Calling the function a business partner without a practice, a figure and a direction leaves the claim standing on nothing.
- A ratio with no denominator. Turnover, absence and cost figures are meaningless until the population and the period are printed beside them.
- An organization made of adjectives. Fast-paced, growing and dynamic describe every employer, which is another way of saying they describe none.
- A conclusion that summarizes instead of concluding. Restating the map wastes the section where you were supposed to say what the map exposed.
Pre-submission checklist
- Every criterion in the scoring guide has its own labelled section
- The organization is described with counts, sites and workforce composition
- Each functional area names what it produces and who receives it
- Headcount and full-time equivalents are both stated, with the conversion shown
- One decision is traced through at least three functions with a cost at each
- Current APA verified in both directions, and every figure re-added by hand
Function analysis due this week?
Send the scoring guide and the organization you plan to write about, with whatever headcount and budget figures you can reach. Eight people, a research analyst and two QA reviewers among them, build a premium original sample to the Distinguished column inside 24 to 48 hours, arithmetic shown, revisions free until the criteria are met.