This manual is for EDD FPX 8050 Assessment 2, start to submission. Assessment 2 of EDD FPX 8050 puts the analysis in front of people who will act on it. The assessment usually asks you to brief a leadership audience on what a data set shows, disaggregate honestly including where the groups are small, and keep the simplification from becoming a distortion. Below: how our tutors build a brief, the structure the criteria reward, and a marked-up briefing passage. Rather hand it over? One premium original brief arrives within 24 to 48 hours, reworked free until every criterion is answered. Capella's catalog lists the course as EDD-FPX8050, and some courserooms print EDD8050; both point to this same Assessment 2.
One honesty note before the manual: Capella revises courses and scoring guides over time, so always write to the exact scoring guide attached to your assessment in the courseroom. The course identity above is verified on capella.edu; the method and structure below are our tutors' approach to it, not Capella's official rubric text.
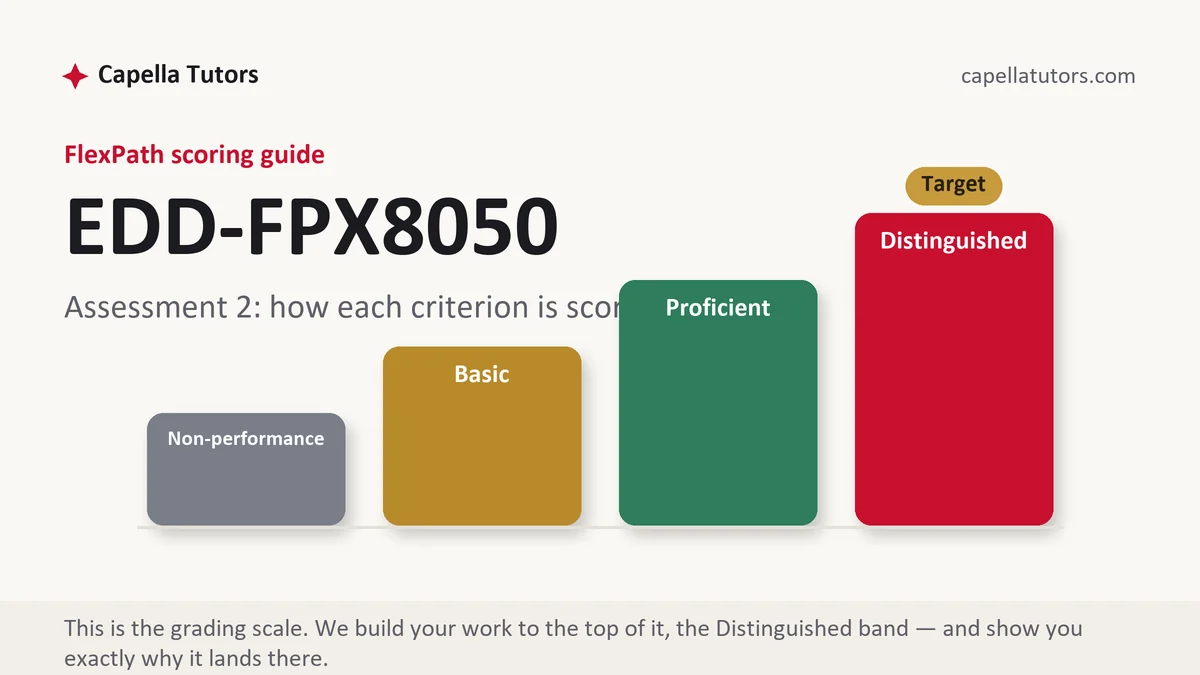
How EDD FPX 8050 Assessment 2 is scored
Each criterion sits at one of four levels, and on a brief the levels separate on how the small groups were handled:
| Level | What it means on a leadership data brief |
|---|---|
| Distinguished | One figure a reader will remember, one comparison that gives it meaning, and one honest caution, with small denominators reported as counts and suppression rules respected rather than quietly worked around. Describing a group you cannot publish a rate for is the top-column move. |
| Proficient | The brief is accurate, disaggregated and clearly presented. Sound, a level under work that showed the students it could not report. |
| Basic | A single headline rate with no baseline and no uncertainty, or a table handed over with no argument on top of it. |
| Non-performance | A required element is absent, most often disaggregation, or any statement of what the audience should not conclude. |
The failure mode in a brief is never simplification, it is unaccompanied simplification. One rate arriving with no baseline, no count and no caution becomes a decision inside ten minutes, and the criteria are written to see whether you sent the number out alone.
The EDD FPX 8050 Assessment 2 method, step by step
-
Quote the definition from whoever set it
Chronic absence is conventionally counted as missing at least ten percent of the days a student was enrolled, and your state's reporting handbook will give you the exact wording, including how partial days and enrollment changes are treated. Copy that sentence into the brief. It settles arguments before they start.
-
Show why the reassuring average hides the problem
Average daily attendance and chronic absence come out of the same file and answer opposite questions, because attendance can be high on most days for most children while the missing days pile up on a minority. Print both, then explain the mechanism, and the room stops debating which figure is the real one.
-
Lead with the count whenever the group is small
On a denominator of a hundred, one student is worth a percentage point and a single enrollment change moves the figure without anybody's attendance changing. Report counts first for these groups, rates second, and never draw a line through two points of a small series.
-
Respect the suppression rule and find another way to see the students
Minimum reporting sizes exist to keep individual children unidentifiable, so combine years, report counts, or move to a case review of every student in the group. What you may not do is treat a suppressed cell as evidence that nothing is wrong. Say the group exists, say why no rate appears, and say how you looked instead.
-
Build the display so the comparison is on the chart
Put the district and the comparison series on the same axes, start the axis where the data starts rather than where the difference looks largest, and label the counts. A display that needs a paragraph to explain what it is not saying should be redrawn.
-
Close with the question they actually asked
When leaders ask whether something worked, answer with what the data supports, then say what evidence would be needed to answer the question underneath theirs. That two-sentence ending is the difference between a brief and a report, and the recommendation criterion lives in it.
A structure that maps to the criteria
Our defaults for a brief of ordinary length; the weighting in your own guide governs.
| Section | What it must do | Guide |
|---|---|---|
| The measure, quoted | The official definition, its source, and how edge cases are treated in it. | ~175 words |
| The headline figure | One number, its count, its window, and the comparison that gives it meaning. | ~200 words |
| Averages against concentration | Why a reassuring aggregate and an alarming rate come from the same file. | ~275 words |
| Disaggregation | Groups that matter locally, counts before rates, with the trend refused where it cannot hold. | ~300 words |
| Groups you cannot publish | Suppressed cells named, and the method you used to examine those students instead. | ~250 words |
| What to decide next, and references | The decision the evidence supports, the evidence still missing, and seventh edition APA. | ~200 words |
Annotated sample excerpt
A model briefing passage from our team, written at the register the top column describes.
Average daily attendance across these 8,900 students was 94.1 percent last year, and 1,602 of them, 18 percent, missed at least ten percent of the days they were enrolled.1 Both figures come out of the same file: attendance is high on most days for most children, and the absence that matters is concentrated in a group large enough to fill three middle schools.2 Among the 112 students identified as experiencing homelessness, 47 were chronically absent, and because that denominator is small I am reporting the count first and declining to draw a trend line through two years of it.3
- 1Sets the reassuring figure beside the alarming one, both defined, so nobody has to be accused of misreporting anything.
- 2Explains the mechanism that lets both be true, which is what stops a cabinet from arguing about which number is real.
- 3Leads with counts on a small denominator and refuses the trend, which is the discipline the equity criterion is looking for.
The full premium sample for your exact assessment, written fresh to your scoring guide and issue, is free to request. Study it, revise it into your own voice, and submit work you understand.
The five mistakes that cost Distinguished
- An average offered as the state of attendance. A 94 percent aggregate and an 18 percent chronic absence rate coexist easily, and reporting only the first misinforms a board.
- A rate published on a denominator of nine. Suppression rules protect identifiable children, and publishing anyway defeats the protection whatever the intent.
- A suppressed cell read as good news. No rate is not the same as no problem, and the criteria are written to catch the substitution.
- An axis chosen to make a point. A truncated scale that dramatizes two points of noise costs the criterion on presentation and the reader's trust at once.
- A brief that ends at the data. Findings with no decision attached leave the recommendation criterion with nothing to score.
Pre-submission checklist
- The official definition quoted, with its source named
- One headline figure with its count, window and comparison
- The aggregate and the concentrated rate printed together and explained
- Counts before rates for every small group, with no trend through two points
- Suppressed groups named, with the alternative method you used stated
- A closing decision plus the evidence still missing, seventh edition APA throughout
Board brief due and the average says everything is fine?
Send the prompt, the criteria, and the report or spreadsheet you were given. A premium original sample returns in 24 to 48 hours with definitions quoted, counts beside every rate, small groups handled honestly, and revisions carried free until the guide is met.