This manual is for BUS FPX 4993 Assessment 2, start to submission. The SWOT Analysis asks you to analyze the capstone organization's internal strengths and weaknesses and its external opportunities and threats, propose strategies that use the analysis, and, in many versions, incorporate feedback from peers on your work. The capstone builds one strategic plan across its assessments, ending with a strategic action plan in Assessment 5. The grade turns on building on your earlier capstone work with evidence. Each part should follow from the analysis before it. Below is the method our tutors use, a structure that maps to the criteria, and an annotated sample excerpt. Prefer to hand it off? A premium original sample for this exact assessment comes back in 24 to 48 hours, revised free until it meets the guide. Capella's catalog lists the course as BUS-FPX4993, and some courserooms print BUS4993; both point to this same Assessment 2. In current courserooms this assessment typically appears as "SWOT Analysis".
One honesty note before the manual: Capella revises courses and scoring guides over time, so always write to the exact scoring guide attached to your assessment in the courseroom. The course identity above is verified on capella.edu; the method and structure below are our tutors' approach to it, not Capella's official rubric text.
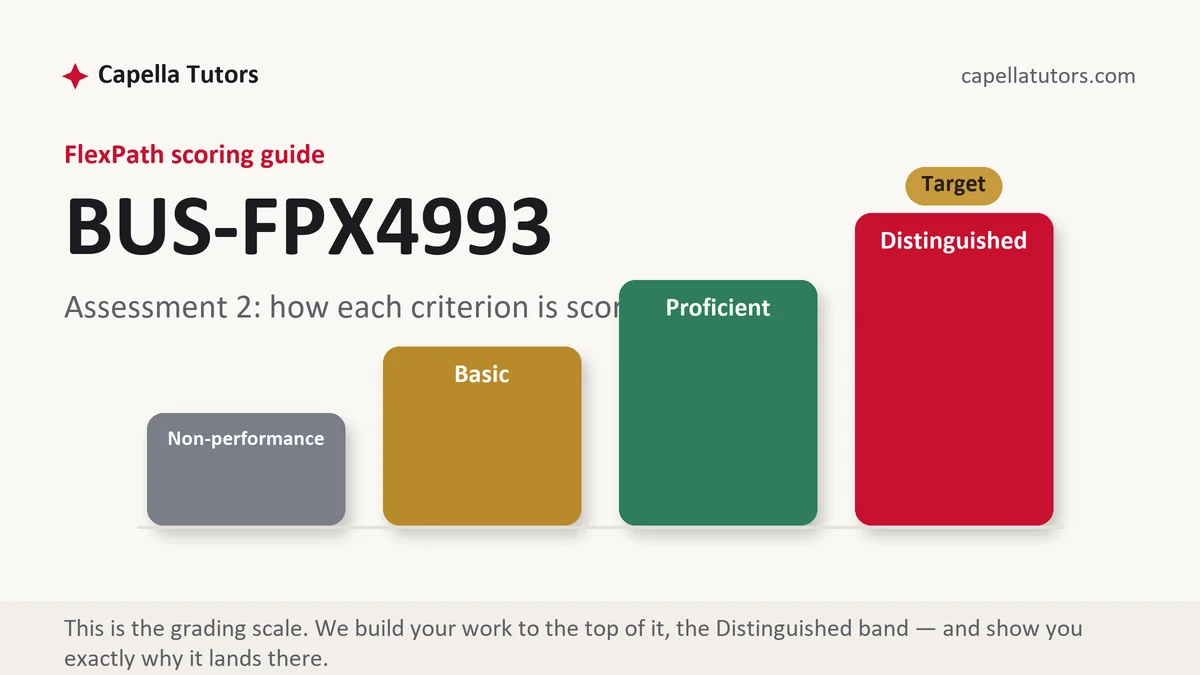
How BUS FPX 4993 Assessment 2 is scored
FlexPath does not use letter grades. Each criterion in the scoring guide lands on one of four levels, and the level descriptions are the real writing brief:
| Level | What it means on a swot analysis for the capstone |
|---|---|
| Distinguished | The swot analysis for the capstone is specific to the organization or case, applies course concepts accurately with credible sources, and ends in justified conclusions or recommendations. |
| Proficient | The swot analysis for the capstone is accurate, but the application or recommendations are general. |
| Basic | The swot analysis for the capstone describes concepts with little application. |
| Non-performance | A required part of the swot analysis for the capstone is missing. |
Use the same organization throughout the capstone.
The BUS FPX 4993 Assessment 2 method, step by step
-
Strengths
Internal advantages with evidence.
-
Weaknesses
Internal limitations with evidence.
-
Opportunities
External trends the organization could use.
-
Threats
External risks.
-
Strategies for development
Using strengths for opportunities and addressing weaknesses and threats.
-
Peer feedback
What you changed in response, if required.
A structure that maps to the criteria
Word counts are planning targets our tutors use, not Capella rules; follow the length and format your scoring guide states.
| Section | What it must do | Guide |
|---|---|---|
| Strengths and weaknesses | Internal factors. | ~150 words |
| Opportunities and threats | External factors. | ~150 words |
| Strategies for development | Strategies from the SWOT. | ~150 words |
| Peer feedback and references | Then references. | ~75 words |
Annotated sample excerpt
An original model excerpt from our team, written to show the register that reaches the top of the guide. Learn the moves, then write your own version.
The company's strongest asset, relationships with local farms, lines up with the growth in diners who want locally sourced food, so the first strategy is to market that sourcing to restaurants as part of their own menus.1 Its main weakness, a small delivery fleet, limits growth into the two neighboring counties where demand is rising, which points to a second strategy of partnering with a regional courier rather than buying trucks.2 Peer feedback noted that my threats section ignored labor shortages, which I added, since driver availability affects both strategies.3
- 1Pairs a strength with an opportunity.
- 2Addresses a weakness with a practical strategy.
- 3Shows how peer feedback changed the analysis.
The full premium sample for your exact assessment, written fresh to your scoring guide and topic, is free to request. Study it, revise it into your own voice, and submit work you understand.
The five mistakes that cost Distinguished
- Definitions without application. Apply each concept to the organization or case.
- No sources. Cite credible business sources.
- Vague recommendations. Make them specific and justified.
- A different organization each time. Keep the same one.
Pre-submission checklist
- Same organization as earlier work
- Required elements complete
- Evidence and sources
- Builds on earlier analysis
- Specific and measurable where relevant
- References
Want the swot analysis for the capstone written?
Send the scoring guide and any materials from your courseroom. Our team returns a premium original swot analysis for the capstone in 24 to 48 hours, revised free until it meets the guide.