This manual is for PSYC FPX 3210 Assessment 2, start to submission. The middle deliverable in Human Lifespan Development usually moves off one person and onto evidence: a set of findings or a small dataset about age and some capacity, which you have to interpret rather than recompute. Nobody is grading your arithmetic here. What the criteria grade is whether you can say in ordinary English what a result means, what it cannot mean, and which parts of the picture a table of averages quietly removes. Below is the order our tutors work in, a structure for a data-interpretation paper, and an annotated excerpt from an original model. Would you rather hand it over? Upload the dataset or the article with your scoring guide and a premium original sample comes back inside 24 to 48 hours, revised free until the interpretation rows clear. Check your own program listing and catalog year before building a term around this course. Capella's catalog lists the course as PSYC-FPX3210, and some courserooms print PSYC3210; both point to this same Assessment 2.
One honesty note before the manual: Capella revises courses and scoring guides over time, so always write to the exact scoring guide attached to your assessment in the courseroom. The course identity above is verified on capella.edu; the method and structure below are our tutors' approach to it, not Capella's official rubric text.
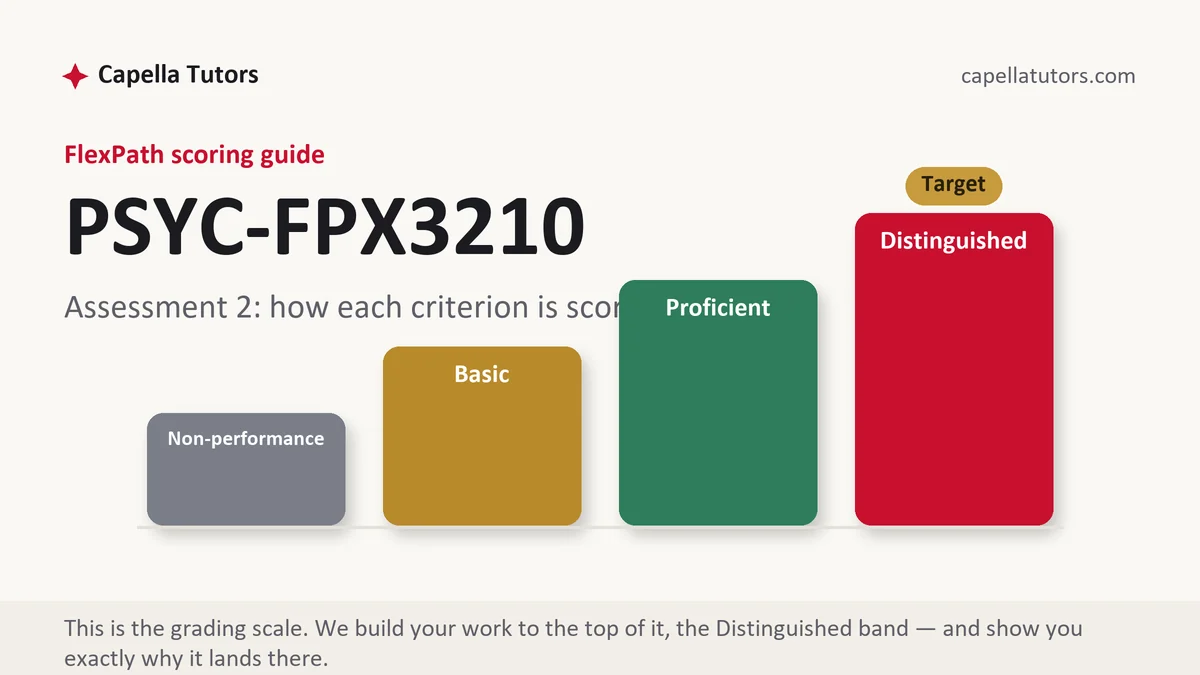
How PSYC FPX 3210 Assessment 2 is scored
Criteria are scored one at a time in FlexPath, and on a paper built around numbers the columns separate over restraint:
| Level | What it means on a data interpretation |
|---|---|
| Distinguished | Each result is stated in plain language first, the numbers follow as support, the spread is placed next to every average, and the verb never claims more than the design earned. The paper also names what would have to be measured to settle the question. |
| Proficient | Results reported accurately with correct language about association, and the limits acknowledged. Sound work that leaves the distributions and the rival explanation unexamined. |
| Basic | The output narrated. Coefficients and means repeated in sentence form, with meaning left implied and every group treated as though its members resembled its average. |
| Non-performance | A required result is not addressed, or the interpretation asserts that age caused the difference, which is a claim no single measurement occasion can support. |
The habit to build here transfers to every later course: read the method before the result. Different people of different ages tested on one afternoon answers a question about groups; the same people followed for twenty years answers a question about change. Both are useful, and they license different sentences.
The PSYC FPX 3210 Assessment 2 method, step by step
-
Describe the dataset before you interpret it
Two or three sentences at the top: how many participants, what ages, what was measured, how it was scored, and how many times each person was tested. Readers cannot evaluate an interpretation without those facts, and evaluators treat their absence as a gap rather than as brevity.
-
Write the headline with no numbers in it
State the finding in a sentence your neighbor would follow, then let the statistic arrive behind it as confirmation. Older participants finished the task more slowly, and the relationship was moderate. Put the coefficient after that, never in place of it, because a sentence that opens on a number has not yet said anything.
-
Put the spread beside every average
An average tells you where a group sits and nothing about how much its members differ, so a table of decade means makes any pattern look tidier than the data are. Report the variability, then say what it implies about how far the two distributions overlap.
-
Give the coefficient its ceiling
A correlation carries direction and strength, and that is all. It cannot say which variable moved first, it cannot rule out something else driving both, and it says nothing about any individual's path. Where age was measured once, add the rival that never goes away: people born in different decades were also schooled, fed and employed differently.
-
Report the numbers the way APA asks
Statistical symbols are italicized, so r, M, SD, N and p all take italics. Values that cannot exceed one lose the leading zero, which makes it .52 rather than 0.52. Give exact p values to two or three decimals instead of a bare inequality, and follow every statistic with a clause in words. That last habit is what makes a bachelor's-level paper readable.
-
Say what would settle it, then self-score
Close by naming the study that would answer the question your data cannot: the same people measured at several time points, with the participants who drop out described rather than ignored. Then mark every criterion yourself against the guide, honestly, and repair anything short of the top column before you submit.
A structure that maps to the criteria
Word targets below are our tutors' planning numbers for an interpretation paper of this size rather than a Capella rule; expand whichever row your guide weights hardest.
| Section | What it must do | Guide |
|---|---|---|
| The question and the data | What was asked, who was measured, on what instrument, and how many times each person was seen. | ~150 words |
| Results in plain English | Each finding as a sentence a non-specialist would follow, with the statistic supporting rather than leading. | ~250 words |
| Spread, overlap and outliers | Variability beside every average, plus what the overlap between groups means for claims about individuals. | ~250 words |
| What the design supports | The verb matched to the design, the cohort rival named, and the third variables that would explain the same pattern. | ~250 words |
| The developmental reading | What the result contributes to an account of change across the lifespan, hedged to the evidence available. | ~200 words |
| Limits and references | The study that would settle the question, and current APA for every statistic and source, matched both ways. | ~150 words |
Annotated sample excerpt
An original model excerpt from our team, taken from the paragraph where a result either stays inside its evidence or quietly escapes it. Learn the moves, then write your own version.
Across the 340 adults in this sample, older participants completed the symbol-matching task more slowly than younger ones, and the relationship was moderate rather than absolute, r = -.52.1 The decade averages make the pattern look neater than it is, since the twenties group scored a mean of 41 correct items and the seventies group 33, while the reported variability inside each decade is wide enough that many participants in their seventies finished ahead of many in their twenties.2 Every participant was measured once, on a single afternoon, so the coefficient describes how these age groups differed and not how any person changed, and the older adults in the room also left school in a different decade from the younger ones.3
- 1The result arrives in ordinary words and the coefficient follows as support. Reversing that order is how a results section starts reading like software output.
- 2Two averages are quoted and then immediately tested against the spread, which is exactly the information an average on its own removes.
- 3One clause turns a design fact into a limit on the verb, and the cohort rival is described in plain terms rather than named as jargon.
The full premium sample for your exact assessment, written fresh to your scoring guide and issue, is free to request. Study it, revise it into your own voice, and submit work you understand.
The five mistakes that cost Distinguished
- Narrating the output. A paragraph of coefficients converted into sentences reports what a program printed and interprets nothing.
- An average with no spread beside it. Group means without variability invite the reader to believe every member of a group resembles it.
- Reading a coefficient as a trajectory. A relationship across people at one moment is not a path any person travelled.
- Verb creep. Associated with becomes leads to becomes causes over three paragraphs, and the criterion notices the last one.
- Treating significance as size. A small p says the pattern is unlikely to be noise, not that the difference matters to anyone.
Pre-submission checklist
- Sample size, age range, instrument and number of testing occasions all stated up front
- Every finding written in plain English before its statistic appears
- Variability reported next to each average, with the overlap between groups discussed
- Verbs matched to the design, and the cohort explanation named rather than avoided
- Statistics in current APA, symbols italicized and leading zeros dropped where they belong
- The study that would settle the question described, and every criterion self-scored
Numbers in front of you and no interpretation yet?
Send the dataset or the article, the prompt and the scoring guide. A premium original sample that reads the results in plain language and keeps every verb inside the design comes back in 24 to 48 hours, revised free until it scores.