How to write PSY-FPX7610 Assessment 3

The short answer

This manual is for PSY-FPX7610 Assessment 3, start to submission. A closing deliverable in this course usually turns to interpretation and fairness, both graded on precision. The assessment usually asks what a given score licenses, given the norm sample it is read against, and whether a group difference is evidence of bias or evidence of a difference. If you would rather not write it, a premium original sample treating the norm mismatch as a limit comes back inside 24 to 48 hours, with revision until the rows are met. Your courseroom may print this as PSY FPX 7610 Assessment 3 or PSY7610 Assessment 3; it is the same deliverable, and PSY-FPX7610 Assessment 3 is what this manual walks through.

One honesty note before the manual: Capella revises courses and scoring guides over time, so always write to the exact scoring guide attached to your assessment in the courseroom. The course identity above is verified on capella.edu; the method and structure below are our tutors' approach to it, not Capella's official rubric text.
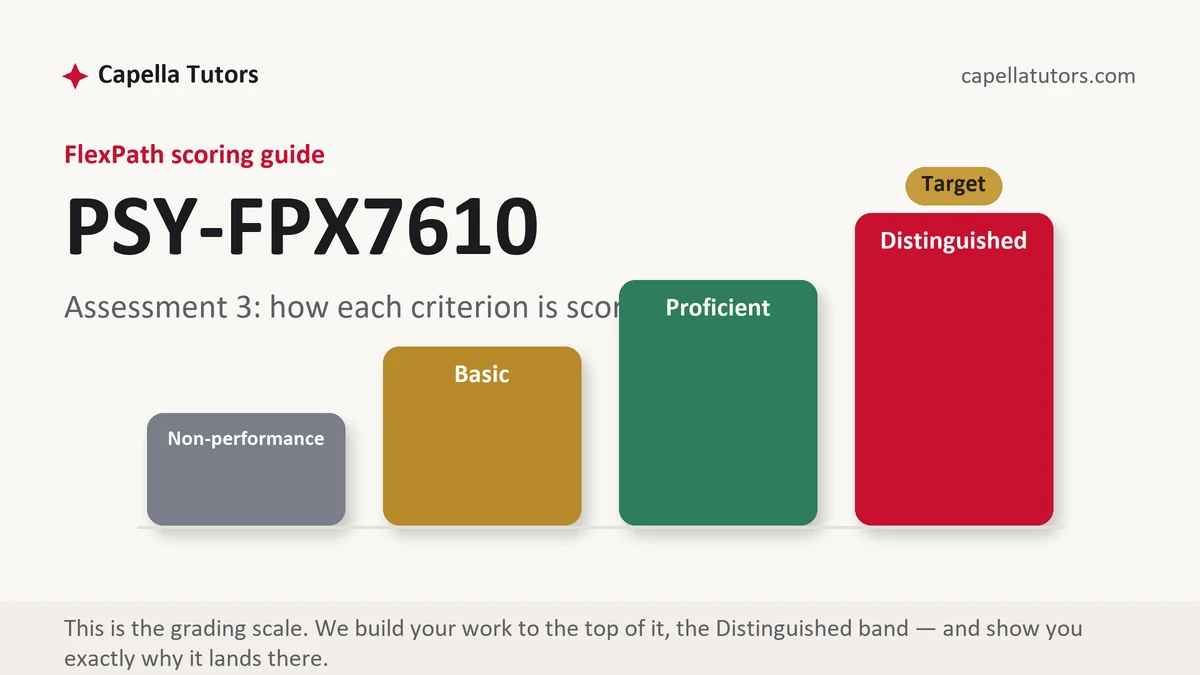
PSY-FPX7610 Assessment 3 grading scale at Capella FlexPath, the criterion levels this assessment is scored on, from Capella Tutors
How Capella FlexPath grades PSY-FPX7610 Assessment 3, visualized by Capella Tutors.

How PSY-FPX7610 Assessment 3 is scored

Every criterion is scored independently at one of four levels, and the top wording asks for technical precision:

LevelWhat it means on a norms and fairness deliverable
DistinguishedScores interpreted with a band, a norm mismatch treated as a limit on the inference, and bias distinguished from mean differences with the assessment standards cited by section.
ProficientNorms described accurately and score metrics interpreted correctly.
BasicPercentiles reported as though they were an equal-interval scale and group differences reported as bias. Where most first attempts at a fairness section land.
Non-performanceA required element absent, most often the fairness evidence.

A group mean difference is not by itself evidence of bias. Bias is a technical claim that scores mean different things across groups, which is what measurement invariance testing and differential item functioning analysis examine, and the distinction is graded every time it comes up.

The PSY-FPX7610 Assessment 3 method, step by step

  1. Map the criteria and describe the norm sample before any score

    Size, recruitment, geography, age range, education and date of collection all belong in the description. A norm sample that no longer resembles the population makes a current score mean something its authors did not intend, and that sentence has to come before any interpretation.

  2. Keep the score metrics apart

    Standard scores, T scores and percentile ranks describe the same person in different currencies. Percentiles are not an equal-interval scale, so the distance from the 50th to the 84th is one standard deviation and the distance from the 84th to the 98th is another, and describing a move near the tail as small treats unequal distances as equal.

  3. Treat a norm mismatch as a limit rather than a caveat

    Where the instrument was developed on one population and applied to another, say what the mismatch does to the inference and how large it could plausibly be. An instrument normed on undergraduates inherits a problem before a single item is answered when it is read against adults in their sixties.

  4. Distinguish bias from difference, with the right evidence

    A mean difference between groups is a description. Bias is a claim about score meaning, and it needs measurement invariance evidence or item-level analysis rather than a comparison of averages. Say which evidence exists for this instrument and which does not.

  5. Handle the practical obligations by section

    Competence for the instrument in hand, informed consent, test security and care in releasing raw scores sit in the assessment standards of the ethics code, and they should be cited by section rather than in general. Reproducing items would breach test security as well as copyright, so describe structure and scoring without printing content.

  6. State what the score licenses, then self-score

    Write one sentence saying what an inference from this score is entitled to be, given the band and the norm mismatch together. Then grade each criterion yourself and submit with room for a review cycle, because one misread metric can cost two rows at once.

A structure that maps to the criteria

The lengths given are our tutors' working plan rather than a Capella rule, so follow your own guide wherever it wants the balance elsewhere.

SectionWhat it must doGuide
The intended use and populationThe decision, the examinees in front of you, and how they differ from the norm group.~200 words
The norm sampleSize, recruitment, demographics, date of collection and recency relative to now.~260 words
Score metricsThe metric reported, its relationship to the others, and what a given value means.~270 words
Norm mismatch as a limitWhat the mismatch does to the inference and how large the effect could plausibly be.~260 words
Bias and invarianceThe invariance or item-level evidence available, and what a mean difference alone does not show.~250 words
Obligations and formatCompetence, consent, security and score release cited by section, plus current APA.as needed

Annotated sample excerpt

An original excerpt from our team showing a norm mismatch treated as a limit on the inference. Read it for the precision, then apply the same treatment to the instrument your criteria name.

Sample excerpt: bias against difference Original model · Capella Tutors

The norms were collected from 428 undergraduates at two universities, with a mean age of 20 and at least twelve years of completed education, and the examinees in this program are community-dwelling adults between 66 and 84 with a wide range of schooling.1 That mismatch is a limit on the inference rather than a caveat at the end of the report: a raw score converted against this table is being compared with a group the examinee does not belong to, so the resulting percentile answers a question nobody asked, and a move from the 84th to the 91st percentile in that table is not a small change since the two are further apart in standard deviations than the 50th and the 60th.2 The older group scores lower on average, and that is a mean difference rather than evidence of bias; the claim that the items mean something different across the two groups would require measurement invariance testing or item-level analysis, neither of which this instrument has published, which is what the report should say rather than either asserting bias or dismissing the possibility.3

  • 1Describes the norm sample with size, setting, age and education, then names the examinee population. The comparison is stated as a fact before any interpretation is attempted.
  • 2Calls the mismatch a limit rather than a caveat, then demonstrates the percentile problem with two intervals from the same table. Handling unequal distances correctly is a criterion by itself.
  • 3Reports the mean difference, refuses to call it bias, names the two kinds of evidence that would settle it, and states that neither exists. Saying what the evidence base lacks is the top-column move.

The full premium sample for your exact assessment, written fresh to your scoring guide and issue, is free to request. Study it, revise it into your own voice, and submit work you understand.

Get the full sample free

The five mistakes that cost Distinguished

  • Percentile ranks read as an equal-interval scale. Calling a shift from the 84th to the 91st percentile minor treats two unequal gaps as though they matched.
  • A group difference reported as evidence of bias. Bias asserts that scores carry different meaning across groups, and it needs invariance testing or item-level analysis rather than two averages.
  • A norm mismatch placed in the limitations paragraph. The mismatch changes what the score licenses, so it belongs in the interpretation rather than after it.
  • Norm recency ignored. Norms age, and a table collected decades ago makes a current score mean something its authors did not intend.
  • Items reproduced to illustrate the instrument. Printing content breaches test security and copyright, and describing structure competently is the graded skill instead.

Pre-submission checklist

  • The norm sample is described with size, demographics and collection date
  • The examinee population is named and compared with the norm group
  • Score metrics are kept apart and percentile distances handled correctly
  • The norm mismatch appears as a limit inside the interpretation
  • Bias is distinguished from mean differences with the evidence named
  • Assessment standards cited by section, no item content reproduced, APA matched both ways

Norms and fairness section due?

Send the guide, the instrument and the group you intend to use it with. We work from the technical manual, the independent review and the validation literature, treat the norm mismatch as a limit on the inference, and keep bias claims separate from mean differences. It returns within 24 to 48 hours, reworked at no cost until every criterion is met.

Keep going

Online now