This manual is for NURS FPX 8020 Assessment 1, start to submission. The opening deliverable in a doctoral executive leadership course is usually an analysis rather than a proposal: read your own nursing enterprise from the inside and from the outside, then report what a senior team would need to know before it commits a dollar to anything. Workforce figures you can source, external pressure named precisely, and one reading that holds the two together. What follows is how our doctoral desk builds that analysis, the shape it takes on the page, and a marked-up excerpt showing the register. Rather hand it over? An original premium sample built to your own scoring guide arrives inside 24 to 48 hours, with rewrites at no cost until the criteria clear. Capella's catalog lists the course as NURS-FPX8020, and some courserooms print NURS8020; both point to this same Assessment 1. In current courserooms this assessment typically appears as "Strategic Plan Appraisal".
One honesty note before the manual: Capella revises courses and scoring guides over time, so always write to the exact scoring guide attached to your assessment in the courseroom. The course identity above is verified on capella.edu; the method and structure below are our tutors' approach to it, not Capella's official rubric text.
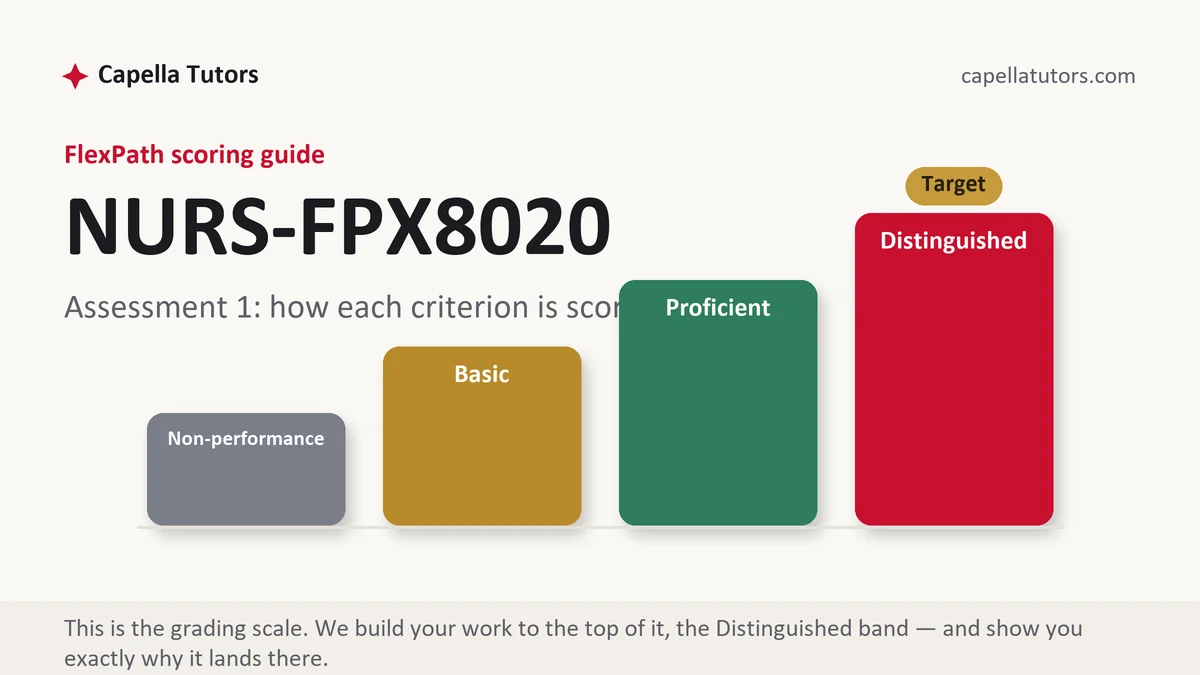
How NURS FPX 8020 Assessment 1 is scored
FlexPath issues no letter grades. Every criterion on the guide lands on one of four levels, and the wording of those levels is the brief you write to:
| Level | What it means on an executive position analysis |
|---|---|
| Distinguished | Internal figures and external pressures are argued as one situation, every number carries its source, and the analysis names which finding the organization should look at first. That last move is written into the criterion; locate it and perform it. |
| Proficient | Internal performance and external forces are both analyzed accurately and completely. Correct, and still filed as two topics rather than read as one position. |
| Basic | A description of the organization with data attached and no reading of what the data oblige anyone to decide. The usual landing spot for a first submission at this level. |
| Non-performance | A required element is missing, most often the external analysis or the provenance behind a figure. Absent rather than thin is what puts a criterion on the floor. |
Treat this one as the foundation it is. The analysis you produce here becomes the evidence base every later deliverable in the course leans on, so a figure you cannot defend now will be quoted back at you twice more before the term closes.
The NURS FPX 8020 Assessment 1 method, step by step
-
Turn the scoring guide into the outline
Paste each criterion into a blank document as a heading and drop its Distinguished wording underneath. Nothing you write outside that skeleton earns credit, and the skeleton also tells you whether the assessment wants a memorandum, a briefing document, or a report, which changes the shape before it changes the content.
-
Fix the altitude before you fix the topic
Ask one question of every paragraph: could a unit manager have written this? If yes, raise it. Enterprise analysis works in divisions, service lines, budgets and multi-year trends, not in shifts and assignments. Most doctoral drafts lose more credit to altitude than to content.
-
Build the internal picture from figures you can source
Pull what your organization already publishes or reports: headcount, vacancy, turnover by tenure band, premium pay, contract labor spend, volume trend. Name where each number came from, whether the human resources dashboard, the operating statement, or the quality report, and give the period it covers.
-
Read the external environment as pressure on those same numbers
Do not write a generic sector overview. Take each external force, regional labor supply, payer mix, regulation, competitor expansion, accreditation expectation, and say which internal figure it is pushing on and in which direction. External analysis that never touches your own data reads as background.
-
Write the synthesis first, then place it first
Draft the section where the two halves meet before you polish either half, because that paragraph is where the criteria concentrate. Then lift the leading finding to the front of the document. An executive reader who reaches page four before learning what you concluded has already decided the writer cannot prioritize.
-
Recompute, then self-score
Check every percentage against its denominator and every total against its parts, because one figure that does not reconcile invites the reader to audit the rest. Then read the draft against the guide, one criterion at a time, and mark yourself D, P, B or N honestly. Anything under D gets another pass before submission.
A structure that maps to the criteria
Lengths below are the planning targets our doctoral desk uses for an executive analysis of this kind, not Capella requirements; stretch any section your scoring guide weights more heavily.
| Section | What it must do | Guide word target |
|---|---|---|
| Purpose and scope | Name the organization, the unit of analysis, the period examined, and the decision this analysis is meant to inform. | ~150 words |
| Internal position | Workforce, financial and quality performance reported with denominators, periods and sources, disaggregated where the aggregate hides something. | ~350 words |
| External position | Labor market, payment, regulation and competition, each tied to the internal figure it presses on. | ~350 words |
| Synthesis | What the two halves mean together, including the tension the organization cannot resolve with its current structure. | ~300 words |
| Implications for the executive team | The finding to act on first, what it would cost to ignore, and the assumption most likely to be wrong. | ~200 words |
| References | Current APA, every citation matched both ways, organizational documents named rather than described. | as needed |
Annotated sample excerpt
An original model paragraph from our doctoral desk, written at the altitude this criterion set rewards. Read it for the moves, then build your own from your own numbers.
The division's executive dashboard reports registered nurse turnover as a single headline figure, 17.4 percent for the twelve months ending in June, and that figure conceals the problem it exists to expose.1 Split by tenure, 61 of the 214 separations occurred inside the first year of hire, so the enterprise is not losing its workforce evenly, it is failing to keep the nurses it has just finished paying to orient.2 Against a first-year replacement cost of $52,000 that the finance office and I priced component by component, that band alone carries about $3.2 million of annual exposure, and it is the figure this analysis asks the executive team to look at instead of the headline.3
- 1Opens by distrusting the organization's own summary metric. A senior reader wants to know what the dashboard is hiding, and the first sentence promises to say.
- 2Disaggregates before it interprets. Splitting a rate by tenure turns a number into a mechanism, which is the whole distance between reporting and analysis.
- 3Converts the finding into money with the assumption sourced and priced locally. A figure built with your finance office survives the meeting; one imported from an article does not.
The full premium sample for your exact assessment, written fresh to your scoring guide and issue, is free to request. Study it, revise it into your own voice, and submit work you understand.
The five mistakes that cost Distinguished
- The organizational tour. History, mission statement and bed count are context, not analysis, and they eat the word budget the synthesis needed.
- Two documents stapled together. An internal section and an external section that never reference each other cannot satisfy a criterion asking you to integrate them.
- Headline metrics left whole. An aggregate rate reported without a tenure, unit or shift breakdown tells an executive nothing they did not already have.
- Unsourced numbers. One figure with no report, no field and no declared assumption behind it makes a reader suspicious of every other figure on the page.
- An analysis that recommends nothing. Even where the prompt stops at analysis, the criteria expect you to say which finding matters most and why.
Pre-submission checklist
- Every criterion in the guide has its own labeled section in the document
- Each internal figure carries a source, a period and a denominator
- Each external force is tied to a specific internal number it moves
- The synthesis names a tension the current structure cannot resolve
- The leading finding appears before the reader reaches the second page
- All arithmetic recomputed and the draft self-scored D on every criterion
Want this analysis built with backup?
Send the scoring guide and whatever workforce and financial figures you can share. A team of eight, including a research analyst and two independent quality reviewers, returns a premium original sample aimed at the Distinguished column in 24 to 48 hours, with free revisions until it lands there. The numbers get reconciled before the narrative is written, which is the reverse of how most drafts arrive.