This manual is for NURS FPX 6424 Assessment 2, start to submission. Hand this one off and a premium original sample arrives inside 24 to 48 hours, revised free until it meets your guide. Assessment 2 of NURS FPX 6424 is where the technique work happens. Your scoring guide decides the format, and the assessment usually asks you to apply a named data mining method to a healthcare dataset and report what it found: the cleaning you did first, the method and why that method, what the output actually says, and the difference between a pattern and a cause. Capella's catalog lists the course as NURS-FPX6424, and some courserooms print NURS6424; both point to this same Assessment 2.
One honesty note before the manual: Capella revises courses and scoring guides over time, so always write to the exact scoring guide attached to your assessment in the courseroom. The course identity above is verified on capella.edu; the method and structure below are our tutors' approach to it, not Capella's official rubric text.
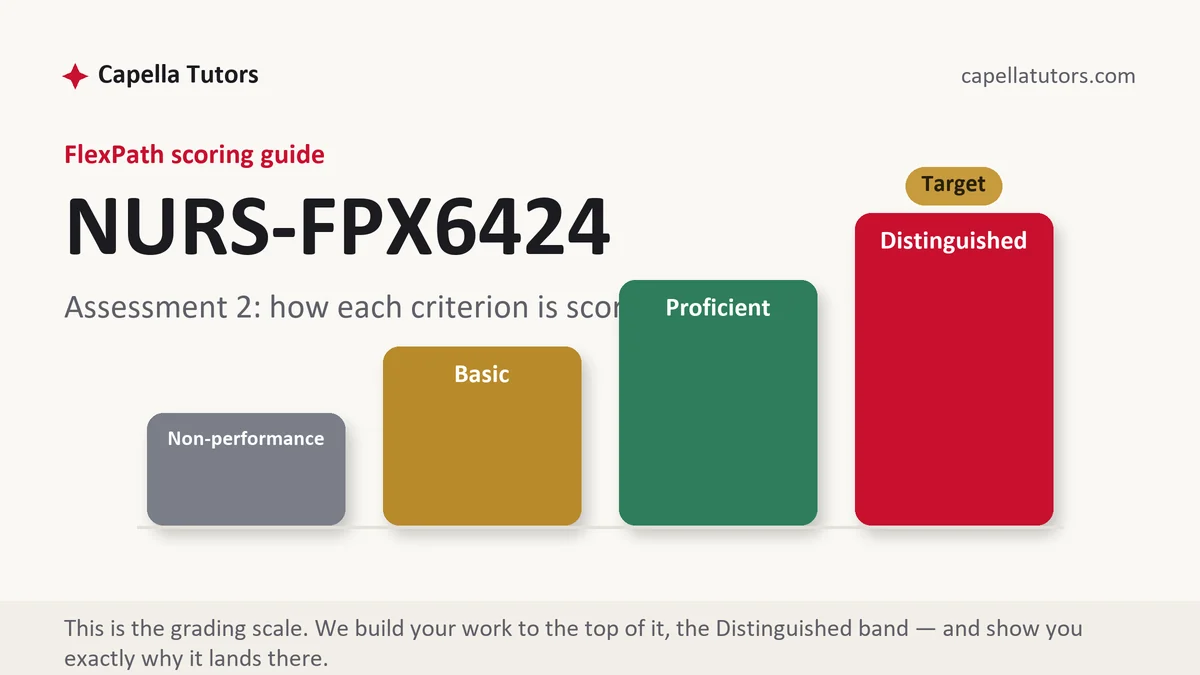
How NURS FPX 6424 Assessment 2 is scored
Each criterion resolves to one of four levels. On an applied analysis the levels separate on whether the writer earned the finding:
| Level | What it means on an applied data mining analysis |
|---|---|
| Distinguished | Cleaning reported before results, the method justified against alternatives, output interpreted with denominators and uncertainty, and every pattern described in language its design supports. |
| Proficient | A correct method correctly applied, with results explained accurately. Competent, and still short of the top, because nothing is said about what could be wrong. |
| Basic | Results presented and described, with the cleaning implied and the method chosen without a reason. The usual first submission, and the criterion caps it. |
| Non-performance | A required criterion has no section, most often the evaluation of the method or the ethical implications of the finding. |
There is a specific reason cleaning comes before conclusions in this course. Healthcare data is generated by people doing clinical work under pressure, so it carries the fingerprints of workflow rather than the neatness of measurement. A finding produced without a cleaning report is a finding about your workflow that you have mistaken for a finding about patients.
The NURS FPX 6424 Assessment 2 method, step by step
-
Profile the dataset before you model anything
Run the boring pass first and write it down: row count, missing values by field, distinct values per categorical field, minimum and maximum on every date and number, duplicate keys, and impossible combinations such as a discharge preceding an arrival. Report the counts you found. This section is short, it is dull, and it is the section that makes everything after it credible.
-
Decide what missing means before you handle it
Missing is not one thing. A blank because the event did not happen, a blank because the field was optional, and a blank because an interface dropped it require different treatment, and silently deleting all three is the most consequential unexamined decision in student analytics. State your rule, state how many rows it affected, and say what changes if you had chosen the other rule.
-
Choose the method against the question, then say why
Match the technique to the shape of the question. Association rules for co-occurrence, clustering for grouping without labels, classification for predicting a labeled outcome, regression for magnitude, and sequence or process mining for order and timing. Name one method you rejected and why. Justification against an alternative is the criterion, not the technique itself.
-
Guard against finding nothing but noise
Hold out data or cross-validate rather than reporting performance on the rows you fit. Report class balance, because a rare outcome makes accuracy meaningless and a model that predicts the majority every time can look excellent. Prefer measures that survive imbalance, and if you mined many combinations, say how many you tested, because testing enough patterns guarantees finding some.
-
Interpret with denominators, uncertainty, and a plain sentence
Every rate gets its numerator, denominator, and window. Every comparison gets an interval or a clearly stated caution about precision. And every finding gets one sentence a nurse manager could repeat correctly, because a result nobody can restate accurately will be restated inaccurately.
-
Keep the causal claim out unless you earned it
Write associated with, followed by, and more likely to be recorded as, and reserve reduced, caused, and prevented for designs that support them. Name the confounder that worries you most and the alternative explanation you cannot rule out. Anchor the methods discussion in peer-reviewed informatics literature, such as work published in the major medical informatics journals and AMIA proceedings, cited in current APA.
A structure that maps to the criteria
The proportions below are how our tutors plan an applied analysis, not Capella requirements; your scoring guide sets the real structure.
| Section | What it must do | Guide |
|---|---|---|
| Question and dataset | The analytic question, the source, the window, and the row count you actually worked with. | ~200 words |
| Data quality report | Missingness, duplicates, impossible values, and the rules you applied with the rows each rule touched. | ~300 words |
| Method and justification | The technique, the reason it fits the question, the alternative rejected, and the validation approach. | ~250 words |
| Results | Output reported with denominators and precision, tables or figures readable without the surrounding prose. | ~300 words |
| Interpretation and limits | What the pattern supports, the confounders, and the causal claims you are declining to make. | ~250 words |
| Implications and references | What a leader could act on, the ethical consideration the finding raises, and current APA sources. | ~200 words |
Annotated sample excerpt
A model excerpt from our writers, showing how a finding reads once it has been earned. Learn the sequence, then write your own around your own dataset.
The extract held 61,338 emergency department encounters across fourteen months, of which 1,902 were removed because the arrival timestamp fell after the disposition timestamp, a pattern concentrated in the eleven days following the March tracking board upgrade and therefore treated as a system artifact rather than as missing data.1 Working from the remaining 59,436 encounters, patients who left without being seen numbered 2,671, or 4.5 percent, and the strongest association in the sequence analysis was not with total volume but with the gap between arrival and first triage contact: encounters waiting more than 27 minutes for triage accounted for 18 percent of arrivals and 54 percent of departures without being seen.2 Triage delay and departure share a queue, so this is a pattern in observational data and not evidence that faster triage would retain those patients; the same crowding that delays triage also lengthens every wait a patient can see.3
- 1Reports the exclusion with its count and its mechanical cause, and classifies it as an artifact rather than deleting it silently. The reader can now audit the decision.
- 2Gives the outcome rate against the cleaned denominator, then reports the association as two shares rather than as a single ratio, which makes the concentration visible without overstating it.
- 3Names the shared cause explicitly and declines the causal reading in the same breath. Identifying the confounder yourself is worth more than any hedge added at the end.
The full premium sample for your exact assessment, written fresh to your scoring guide and issue, is free to request. Study it, revise it into your own voice, and submit work you understand.
The five mistakes that cost Distinguished
- Results before cleaning. An analysis that opens on findings asks the reader to trust a dataset nobody has described, and the data-quality criterion is usually the easiest one in the guide to earn.
- Rows dropped silently. Deleting incomplete records without stating the rule or the count changes the population under study and hides the change from everyone including the writer.
- Method chosen by familiarity. Using the technique you know rather than the one the question needs is visible in the results, and the criterion asks for justification against an alternative.
- Accuracy on an imbalanced outcome. A 96 percent accurate model on a 4 percent outcome may be predicting nothing at all, and reporting that figure unqualified reads as inexperience.
- Causal verbs on observational data. Would reduce and prevented are design claims. Associated with costs nothing and keeps the finding defensible under questioning.
Pre-submission checklist
- Row count, missingness, duplicates, and impossible values reported before any result
- The rule for handling missing data stated, with the number of rows it affected
- Method justified against one named alternative, and the validation approach described
- Class balance reported, and metrics chosen to survive it
- Every rate carries a numerator, a denominator, and a window
- Findings written in associative language, with the leading confounder named
Need the analysis written up?
Send the scoring guide and your dataset or its description. A research analyst builds the evidence and methods layer first, an informatics writer drafts the analysis criterion by criterion, and two quality reviewers grade it the way a Capella evaluator would before delivery inside 24 to 48 hours. Revisions stay free until it meets target.