This manual is for NURS FPX 6016 Assessment 3, start to submission. Upload the criteria and whatever data set your courseroom supplied, and a premium original sample arrives inside 24 to 48 hours, written to the Distinguished column with free revisions until it fits. The closing deliverable of NURS FPX 6016 usually pairs two jobs: read a body of quality data honestly, then propose an initiative that follows from what you read. The proposal is judged against the analysis, so a strong plan attached to a shallow reading of the numbers loses points in both halves. Capella's catalog lists the course as NURS-FPX6016, and some courserooms print NURS6016; both point to this same Assessment 3. In current courserooms this assessment typically appears as "Data Analysis and Quality Improvement Initiative Proposal".
One honesty note before the manual: Capella revises courses and scoring guides over time, so always write to the exact scoring guide attached to your assessment in the courseroom. The course identity above is verified on capella.edu; the method and structure below are our tutors' approach to it, not Capella's official rubric text.
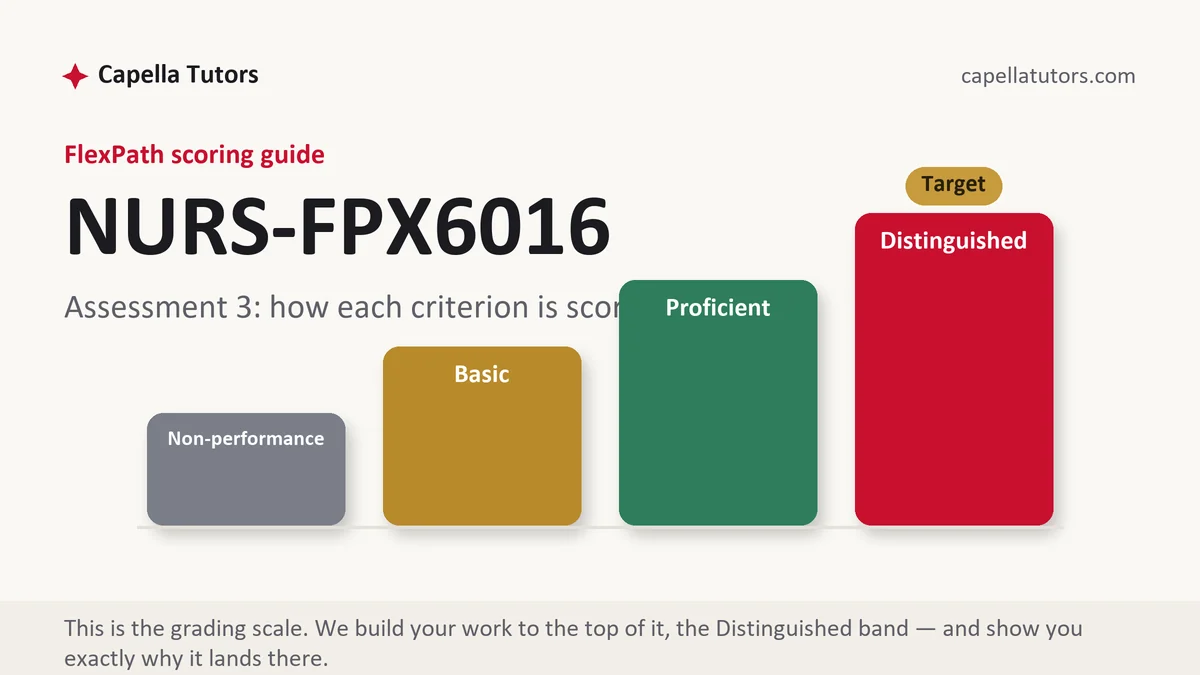
How NURS FPX 6016 Assessment 3 is scored
Each criterion sits at one of four levels, and here the top column is describing a quality analyst's habits rather than a writer's:
| Level | What it means on a data analysis and proposal |
|---|---|
| Distinguished | The data's limits are stated before conclusions are drawn from it, variation over time is read rather than averaged away, the proposal follows the phases of the model it names, and the resource ask is stated in real units. |
| Proficient | The data is summarized correctly and the proposal is sensible and complete. Nothing is wrong and nothing has been interrogated. |
| Basic | Numbers restated as prose, a model named in one paragraph, and a plan whose steps do not follow that model's phases. |
| Non-performance | An element is missing, most often the balancing measure, the cost or staffing estimate, or the data limitations the guide asked you to acknowledge. |
Quantitative honesty is the register marker in this deliverable. Rates get denominators. Small numerators get a sentence saying that a change of two cases in a month of eleven is noise until it repeats. Comparisons across units get a note on whether the populations are comparable, because case mix explains a great deal of apparent variation, and an evaluator who has published will look for that note before believing anything else you say.
The NURS FPX 6016 Assessment 3 method, step by step
-
Establish what the data set can and cannot answer
Before any interpretation, write a short paragraph on provenance: who collected it, how, over what period, with what definitions, and which cases it excludes. Administrative claims data answers different questions from chart review, and voluntary reports answer almost none about incidence. This paragraph protects every claim you make afterward.
-
Read the numbers as a series, not as a single figure
Put the measure in time order and look at the shape. A single quarter tells you where you were standing; twelve months tells you whether anything is moving, and whether a spike is a signal or the normal width of the variation. Say which it is, and if the count is small, say plainly that the swing is inside the range chance would produce.
-
Benchmark before you propose
Compare against something outside your own record: a national rate from federal agency data, a published cohort, or a peer facility of similar size and case mix. A rate that looks alarming can be ordinary and a rate that looks ordinary can be poor, and a proposal built without that comparison is aimed at a target you have not confirmed exists.
-
Choose one improvement model and actually follow it
Plan-Do-Study-Act suits a change you intend to test small and adjust. Lean suits waste and delay in a process nobody has mapped. Six Sigma and its define, measure, analyze, improve, control sequence suits variation in a process that already has usable data. Name your choice, say why in one sentence, then make your plan headings match that model's phases, because evaluators check the match.
-
Specify the change and its measures in the same breath
Each component of the initiative gets a delivering role, a trigger, and a place in the existing workflow, and each gets something that would move if it were carried out. Build the set with an outcome measure, at least one process measure, and one balancing measure that would reveal harm shifting elsewhere. Every measure needs a defined numerator, the population it is drawn from, the system the number comes from, a reporting interval, and somebody whose name sits beside it.
-
Cost it, name what will resist it, then self-score
State the resource ask in units a manager recognizes: hours per week, a percentage of a role, a license, a build request in the electronic record. Then name two forces that will push back, competing priorities during rounds, a discipline that does not attend the meeting where this is announced, and say how the design survives them. Self-score every criterion before submitting, early in the week.
A structure that maps to the criteria
Planning targets our tutors use for a deliverable of this shape rather than Capella requirements; expand wherever your own criteria carry more weight.
| Section | What it must do | Guide |
|---|---|---|
| Data set and its limits | Provenance, definitions, period, exclusions, and what the data therefore cannot support. | ~200 words |
| Analysis of the data | The measure over time with the shape of the variation named, subgroups where they matter, and small-number caution where it applies. | ~350 words |
| Benchmark comparison | An external comparison with a source, plus a note on whether the populations are comparable. | ~200 words |
| Proposed initiative | The model named, its phases as your headings, and each component tied to a finding from the analysis. | ~350 words |
| Measures and reporting | Outcome, process, and balancing measures, each with definition, source, interval, and owner, plus who reviews the report and when. | ~250 words |
| Resources and barriers | The ask in real units, two predictable sources of resistance, and the design features that answer them. | ~200 words |
Annotated sample excerpt
An original passage from our team, written at the level the top column asks for. Learn the moves and build your own.
Thirty-day all-cause readmission for patients discharged with a chronic obstructive pulmonary disease exacerbation ran at 22.4 percent across the twelve months reviewed, 187 readmissions against 835 index discharges, with monthly rates between 17 and 29 percent and no trend across the series.1 The two highest months are separated by seven months and each rests on fewer than 70 discharges, so the spread is consistent with ordinary variation rather than with a change in performance.2 Against the national rate of roughly 20 percent for this condition, the gap is real but modest; the more actionable finding sits in the subgroup analysis, where patients discharged without a scheduled follow-up inside seven days readmitted at 31 percent against 16 percent for those who had one.3
- 1Rate, numerator, denominator, period, and the shape of the series, all before any interpretation. This is the sentence that makes the rest of the paper trustworthy.
- 2Refuses to read a spike as a signal, and says why in terms of sample size. Restraint of this kind reads as expertise to a graduate evaluator.
- 3Benchmarks first, then moves the argument to the subgroup where a change is actually available. The proposal now has a target the analysis produced.
The full premium sample for your exact assessment, written fresh to your scoring guide and issue, is free to request. Study it, revise it into your own voice, and submit work you understand.
The five mistakes that cost Distinguished
- Numbers restated rather than read. A paragraph that converts a table into sentences has described the data and answered no criterion about analyzing it.
- A spike treated as a trend. Small monthly counts swing widely, and a proposal aimed at last quarter's noise will be aimed at nothing by the time it is approved.
- A model named and then abandoned. If your plan headings do not match the phases of the model you claimed, the mismatch is the first thing an evaluator notices.
- No balancing measure. Improvement that pushes harm somewhere else looks like success in an unbalanced measure set, and the criterion exists to catch exactly that.
- A proposal with no price. Hours, roles, and build requests are what turn a plan into something a committee can approve or refuse.
Pre-submission checklist
- A provenance paragraph states the data's definitions, period, exclusions, and limits
- Every rate carries its numerator and denominator, and small numbers carry a caution
- An external benchmark is cited, with a note on population comparability
- The plan's headings match the phases of the model it names
- Outcome, process, and balancing measures each have a definition, source, interval, and owner
- The resource ask is stated in hours, roles, or build requests, with two barriers answered
Finishing NURS FPX 6016?
Send the data set, the prompt, and the guide. Our research analyst handles the benchmarking and the measure definitions, and a premium original sample comes back in 24 to 48 hours with the model, the phases, and the resource ask written the way a quality committee expects to read them.