This manual is for MBA FPX 5008 Assessment 1, start to submission. Interpreting Graphical Representations of Data in Articles or Reports asks you to read the graphs in a business article or report, such as data on deals offered and closed on a television investment show: describe what each chart shows, interpret the patterns, judge whether the graphics represent the data fairly, and explain what conclusions they support. The grade turns on accurate reading and critical judgment. Restating a chart's title scores low; explaining the pattern and whether the chart could mislead scores high. Below is the method our tutors use, a structure that maps to the criteria, and an annotated sample excerpt. Prefer to hand it off? A premium original sample for this exact assessment comes back in 24 to 48 hours, revised free until it meets the guide. Capella's catalog lists the course as MBA-FPX5008, and some courserooms print MBA5008; both point to this same Assessment 1. In current courserooms this assessment typically appears as "Interpreting Graphical Representations of Data in Articles or Reports".
One honesty note before the manual: Capella revises courses and scoring guides over time, so always write to the exact scoring guide attached to your assessment in the courseroom. The course identity above is verified on capella.edu; the method and structure below are our tutors' approach to it, not Capella's official rubric text.
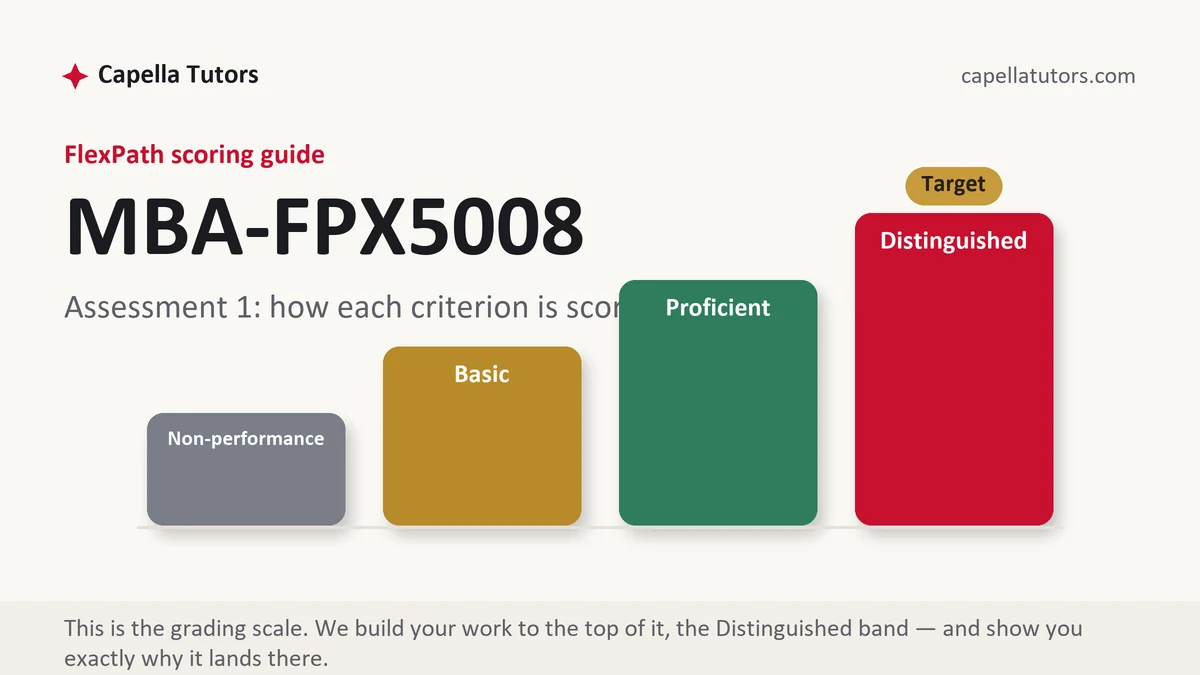
How MBA FPX 5008 Assessment 1 is scored
FlexPath does not use letter grades. Each criterion in the scoring guide lands on one of four levels, and the level descriptions are the real writing brief:
| Level | What it means on a graph interpretation |
|---|---|
| Distinguished | The graph interpretation is specific to the organization or case, applies course concepts accurately with credible sources, and ends in justified conclusions or recommendations. |
| Proficient | The graph interpretation is accurate, but the application or recommendations are general. |
| Basic | The graph interpretation describes concepts with little application. |
| Non-performance | A required part of the graph interpretation is missing. |
Use the article or data your courseroom provides.
The MBA FPX 5008 Assessment 1 method, step by step
-
Identify each graphic
Type, variables and scale.
-
Describe the data
What the chart literally shows.
-
Interpret the pattern
Trends, comparisons and outliers.
-
Judge fairness
Axis scales, truncation, missing context.
-
Draw conclusions
What the data support and what they do not.
-
Cite the source
Article and data.
A structure that maps to the criteria
Word counts are planning targets our tutors use, not Capella rules; follow the length and format your scoring guide states.
| Section | What it must do | Guide |
|---|---|---|
| Introduction | Article and purpose. | ~50 words |
| First graphic interpreted | Description and meaning. | ~100 words |
| Second graphic interpreted | Description and meaning. | ~100 words |
| Conclusion and references | Then references. | ~50 words |
Annotated sample excerpt
An original model excerpt from our team, written to show the register that reaches the top of the guide. Learn the moves, then write your own version.
The bar chart shows more deals offered than closed in every season, which suggests that many on-air agreements fall apart afterward.1 Its vertical axis starts at 20 rather than zero, however, which exaggerates the gap between the bars and makes the drop-off look larger than the counts alone suggest.2 Read with the actual numbers, the conclusion is still that a meaningful share of deals do not close, but the chart overstates it.3
- 1Describes the pattern.
- 2Identifies a design choice that distorts it.
- 3Reaches a corrected conclusion.
The full premium sample for your exact assessment, written fresh to your scoring guide and topic, is free to request. Study it, revise it into your own voice, and submit work you understand.
The five mistakes that cost Distinguished
- Definitions without application. Apply each concept to the organization or case.
- No sources. Cite credible business sources.
- Vague recommendations. Make them specific and justified.
- Restating titles. Interpret the data.
Pre-submission checklist
- Graphics identified
- Data described
- Patterns interpreted
- Fairness judged
- Conclusions drawn
- Source cited
Want the graph interpretation written?
Send the scoring guide and any materials from your courseroom. Our team returns a premium original graph interpretation in 24 to 48 hours, revised free until it meets the guide.