This manual is for MAT FPX 2150 Assessment 3, start to submission. The third deliverable in this course usually asks you to compare two moments and report the comparison honestly. Money from different years is not comparable until it is adjusted, and a total is not comparable across a growing population until it is divided. Both corrections are arithmetic; the marks are in choosing them, sourcing them, and saying plainly what the adjusted figure shows. From here the page gives our tutors' method, a structure built from the rows, and an annotated excerpt. Rather have the corrections drafted? A premium original sample for the comparison you were handed comes back inside 24 to 48 hours, revised at no cost until the rows clear. Capella's catalog lists the course as MAT-FPX2150, and some courserooms print MAT2150; both point to this same Assessment 3.
One honesty note before the manual: Capella revises courses and scoring guides over time, so always write to the exact scoring guide attached to your assessment in the courseroom. The course identity above is verified on capella.edu; the method and structure below are our tutors' approach to it, not Capella's official rubric text.
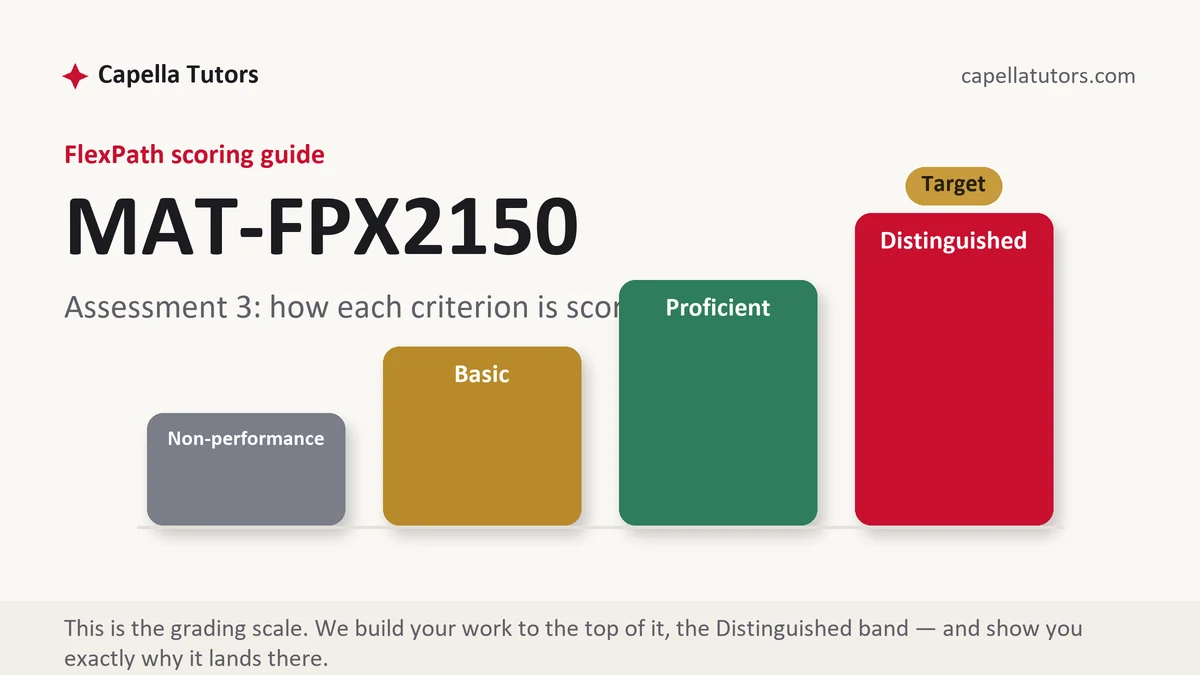
How MAT FPX 2150 Assessment 3 is scored
There is nothing here to average or curve. Each criterion is marked at one of four levels, and the wording of each is the brief for that section:
| Level | What it means on a cross-year comparison deliverable |
|---|---|
| Distinguished | The nominal change is computed and reported, the base year is named, the price adjustment is made from a federal series cited by name and date, the per-resident figure is given where population moved, and the corrected sentence says which direction the quantity actually went. |
| Proficient | Both adjustments are made correctly and the conclusion is right. Accurate work that leaves the base year and the sources understated. |
| Basic | The nominal change quoted as growth, or an adjustment made with a factor that arrives from nowhere. |
| Non-performance | A required element is missing, usually the adjustment itself or the source behind it. An absent element sits at the floor. |
An unadjusted comparison across eighteen years measures inflation and calls it growth. Do both corrections in a fixed order, prices first and then population, and state the base year once at the top, because a reader who cannot tell which year your dollars are in cannot check any figure below it.
The MAT FPX 2150 Assessment 3 method, step by step
-
Turn the criteria into headings and name the reader
The audience decides whether you write in dollars per resident or in percentages, and the communication row is graded against that person. Note it before you compute anything.
-
Quote the comparison and compute it as published
Give the flyer's own sentence and reproduce its arithmetic, so the nominal change is on the page as a fact rather than as something you are dismissing.
-
Choose a base year and say so once
Every adjusted figure in the document has to be in dollars of the same year. Announce which year at the top and hold to it, since mixed bases are the error that makes a whole table unreadable.
-
Adjust for prices from a federal series
Use a published price index and cite the series, the span, and the retrieval date. Show the multiplication rather than the result, because a factor with no provenance cannot be credited however right it is.
-
Divide by population where population moved
A total serving 84,000 residents and the same total serving 103,000 are different levels of service. Give the per-resident figure in adjusted dollars, and say where the population count came from.
-
State which direction it went, then self-score
One sentence naming the real change, its size, and its basis. Then mark every row against the guide and submit with two business days in hand for the evaluation.
A structure that maps to the criteria
The counts are our planning figures for a cross-year comparison rather than Capella rules; your guide decides what each part is worth.
| Section | What it must do | Guide word target |
|---|---|---|
| The published comparison | The claim quoted exactly, the two years involved, and the nominal change as advertised. | ~140 words |
| The base year | The year your adjusted dollars are stated in, announced once and held throughout. | ~120 words |
| The price adjustment | The index used, its source and span, the multiplication shown, and the adjusted figure. | ~250 words |
| Per resident | The population figures with their source, and the adjusted amount divided through. | ~210 words |
| The honest version | The direction and size of the real change, in one sentence for the named reader. | ~200 words |
| Sources | The flyer cited as itself, the price series and population table cited in current APA with retrieval dates. | as needed |
Annotated sample excerpt
A model excerpt from our writers at the level the guide's highest column asks for. Take the moves and write your own version.
The mailer states that library funding is up 38 percent since 2008, and the arithmetic behind it is sound in its own terms: 1.85 million dollars in 2008 against 2.55 million in the current budget is a nominal rise of 37.8 percent.1 Stating every figure in current dollars, the federal price series for that span puts prices about 48 percent higher, so the 2008 appropriation is worth about 2.74 million dollars today and real funding has fallen by roughly 7 percent rather than risen.2 Population moved as well, from about 84,000 residents to about 103,000, so real spending per resident went from about 32.60 dollars to about 24.76 dollars, a decline near 24 percent, and that is the figure a resident asking what the library can afford would want.3
- 1The published claim is quoted and its arithmetic confirmed before anything is corrected, which keeps the analysis from reading as a contradiction of a true statement.
- 2The base year is announced and the price factor is attributed to a series rather than asserted, then the multiplication is carried out where a reader can follow it.
- 3The population correction is applied on top of the price correction, in that order, and the closing clause hands the reader the figure their actual question needs.
The full premium sample for your exact assessment, written fresh to your scoring guide and issue, is free to request. Study it, revise it into your own voice, and submit work you understand.
The five mistakes that cost Distinguished
- Amounts from two different years compared as if they were the same money. An unadjusted comparison across a long span measures price changes and reports them as growth.
- An adjustment factor with no source. A multiplier taken from memory cannot be checked, and the row asks which series produced it.
- The base year never stated. Adjusted figures are meaningless until a reader knows which year's dollars they are in.
- Population growth ignored. The same total spread over more residents is less service each, and per capita is the honest basis when population moved.
- Corrections applied in a jumbled order. Prices first, then population, keeps every intermediate figure interpretable and keeps the table auditable.
Pre-submission checklist
- A heading for each row, and the reader the rewrite is for named first
- The claim quoted and its nominal arithmetic reproduced
- A single base year announced and used for every adjusted figure
- The price index named with its span and retrieval date, and the multiplication shown
- Population figures sourced and the adjusted amount divided through per resident
- One sentence naming the real direction and size of the change, every row self-scored
A comparison across years to correct?
Send the criteria and the flyer, report, or article you were given. Eight people work the file, ending with an editor who reads the plain-English version as a reader with no statistics background would, and one pass recomputes every adjustment from the raw figures. Delivery runs inside 24 to 48 hours, with revision free until the guide is met.