This manual is for MAT FPX 2150 Assessment 2, start to submission. The middle deliverable in this course usually turns on a piece of arithmetic that goes wrong quietly. Averages of averages, per capita figures that ignore population, and rates quoted over mismatched periods all belong to the same family, and the published version of each is usually defensible until you look at the weights. Next come our tutors' method, a structure built from the rows of the guide, and an annotated excerpt. Want the arithmetic done for you? A premium original sample using the figures you were given lands in 24 to 48 hours, with revision continuing free until it clears. Capella's catalog lists the course as MAT-FPX2150, and some courserooms print MAT2150; both point to this same Assessment 2.
One honesty note before the manual: Capella revises courses and scoring guides over time, so always write to the exact scoring guide attached to your assessment in the courseroom. The course identity above is verified on capella.edu; the method and structure below are our tutors' approach to it, not Capella's official rubric text.
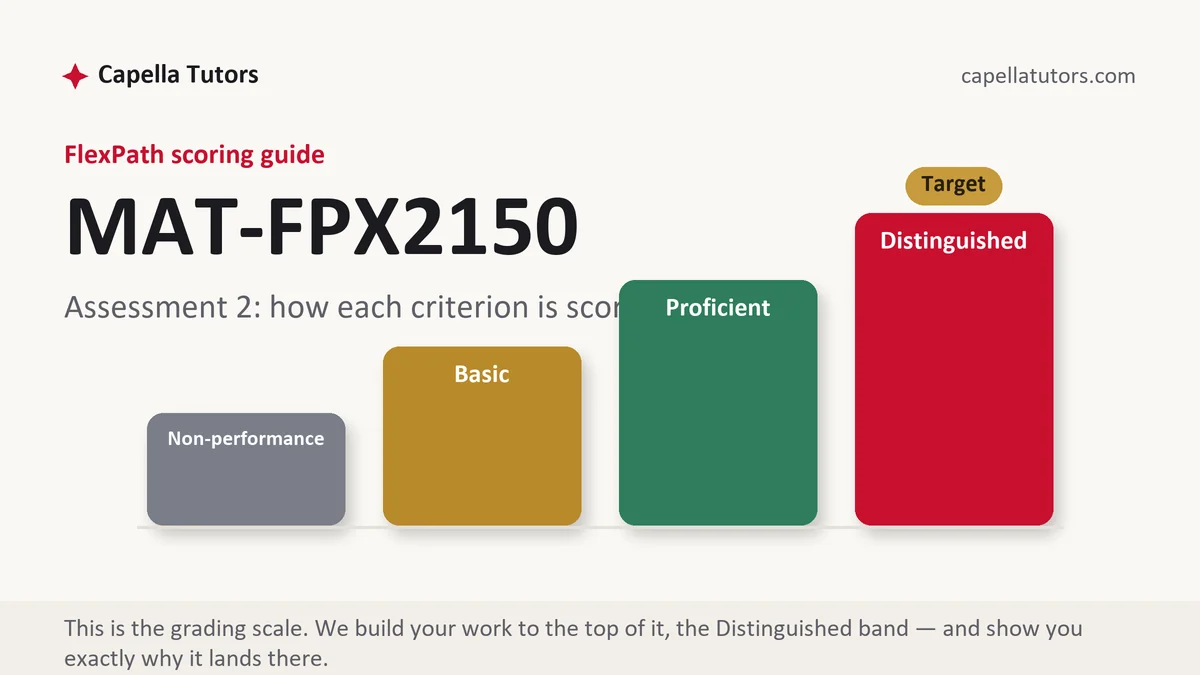
How MAT FPX 2150 Assessment 2 is scored
Levels, not scores, are what an evaluator records. Each criterion gets one of four, and their wording tells you exactly what has to be visible:
| Level | What it means on a weighted average deliverable |
|---|---|
| Distinguished | The published figure is reproduced so the method behind it is visible, the correct weights are identified and used, both results are shown side by side, the size of the gap is explained by where the weight sits, and the corrected figure is written for the reader the prompt named. |
| Proficient | The weighting is done correctly and the corrected figure is right. Accurate work that never explains why the two differ. |
| Basic | The published figure recomputed with no account of which weights belong, or the correct figure produced with the original never reproduced for comparison. |
| Non-performance | A required element is absent, commonly the weights themselves or the comparison. Absence is scored as absence. |
Two averages can be combined only when the groups behind them are the same size, and the further apart the group sizes are, the further the unweighted figure drifts. Say where the weight sits, because the sentence identifying the largest group is usually the sentence that explains the whole gap.
The MAT FPX 2150 Assessment 2 method, step by step
-
Map the criteria and fix the audience
One heading per row, and the intended reader written at the top. A corrected statistic that a prospective student could not use fails the communication row however good the arithmetic is.
-
Reproduce the published figure first
Work out how the original was calculated and show that you can reach it. Demonstrating the method is what turns an accusation into an analysis, and the row usually asks for it explicitly.
-
Find the weights and say where they came from
Group sizes, section counts, populations, or spans of time, each traced to a source. A weighted average is impossible until the weights are on the page, and a weight with no source cannot be credited.
-
Compute the weighted figure with the arithmetic visible
Multiply each value by its weight, sum, and divide by the total weight, showing the products rather than the finished total. That line is the method row for this deliverable.
-
Put both figures side by side and explain the gap
Name the group carrying most of the weight and say how far it pulls the honest figure from the published one. The explanation, not the difference, is what separates the upper columns.
-
Write the corrected statistic, then self-score
One sentence in the units the reader lives in, with the basis stated. Then mark each row yourself against the guide and submit with two business days to spare.
A structure that maps to the criteria
These counts are targets we work to when reweighting a statistic; the guide attached to your assessment sets the real proportions.
| Section | What it must do | Guide word target |
|---|---|---|
| The published figure | The statistic as it was advertised, quoted exactly, with where and when it appeared. | ~130 words |
| How it was computed | The method behind the original, reproduced so the reader can see the figure arise. | ~190 words |
| The weights | The group sizes or populations that belong in the calculation, each with its source. | ~200 words |
| The weighted result | The products, the sum, and the division shown, with units carried through. | ~230 words |
| The gap explained | Both figures side by side, and the group whose size accounts for the difference. | ~210 words |
| Sources | The advertisement or report cited as itself, the enrollment or population table cited in current APA. | as needed |
Annotated sample excerpt
An original passage our team produced at the standard the top column describes. Read it for its method and build yours.
The admissions page advertises an average class size of 19, and the figure can be reproduced by averaging the four departmental averages of 12, 14, 16, and 34, whose unweighted mean is exactly 19.1 The registrar's section counts show why that is the wrong operation: the departments run 8, 10, 12, and 40 sections respectively, so total enrollment is 96 + 140 + 192 + 1,360, or 1,788 students across 70 sections, and the weighted average class size is 25.5 students.2 The whole gap sits in one department, which runs more than half the sections at 34 students each, so the honest sentence for a prospective student is that the college's 70 sections average 25.5 students, with the largest department averaging 34 and three smaller ones between 12 and 16.3
- 1The published figure is reproduced before it is questioned, which shows the method rather than merely alleging one. That reproduction is usually its own row.
- 2The weights arrive with their source and the products are shown rather than only the total, so a reader can audit each line of the arithmetic.
- 3The gap is explained by naming the group that carries the weight, and the rewrite gives the prospective student both the overall figure and the range behind it.
The full premium sample for your exact assessment, written fresh to your scoring guide and issue, is free to request. Study it, revise it into your own voice, and submit work you understand.
The five mistakes that cost Distinguished
- Two averages averaged together. Without weighting by group size the result describes nobody in either group, and here it understates by six and a half students.
- Weights used with no source. Section counts and populations are published figures, and a weight nobody can trace cannot be credited.
- The published figure never reproduced. Reaching the original number is what turns the analysis into a demonstration instead of an accusation.
- A total shown with no products. The row asks how the weighted figure was reached, so each value times its weight has to be visible.
- The gap stated but not explained. Naming the group whose size accounts for the difference is the sentence the analysis row is buying.
Pre-submission checklist
- One labeled section per criterion, and the intended reader named up front
- The advertised statistic quoted exactly with its source and date
- The original method reproduced so the published figure arises on the page
- Every weight stated with its source, and each product shown before the sum
- Both figures placed side by side and the gap explained by where the weight sits
- A corrected sentence written for the named reader, every row self-scored
A published statistic that will not add up?
Send the criteria and the report, page, or flyer you were assigned. Eight people handle the file, among them a reviewer who re-derives every percentage from the raw figures and a scoring-guide reviewer who marks the draft row by row. Delivery is 24 to 48 hours, revised at no charge until the guide is satisfied.