This manual is for MAT FPX 2001 Assessment 3, start to submission. Analyzing Data with Descriptive Statistics asks you to summarize a data set, usually one provided in the courseroom or from your survey: calculate measures of center and spread such as the mean, median and standard deviation, create appropriate graphs, and interpret what the results show in plain language for the question being studied. The grade turns on interpretation. Correct numbers are required, but the top column rewards explaining what they mean, including when the median tells a truer story than the mean. Below is the method our tutors use, a structure that maps to the criteria, and an annotated sample excerpt. Prefer to hand it off? A premium original sample for this exact assessment comes back in 24 to 48 hours, revised free until it meets the guide. Capella's catalog lists the course as MAT-FPX2001, and some courserooms print MAT2001; both point to this same Assessment 3. In current courserooms this assessment typically appears as "Analyzing Data with Descriptive Statistics".
One honesty note before the manual: Capella revises courses and scoring guides over time, so always write to the exact scoring guide attached to your assessment in the courseroom. The course identity above is verified on capella.edu; the method and structure below are our tutors' approach to it, not Capella's official rubric text.
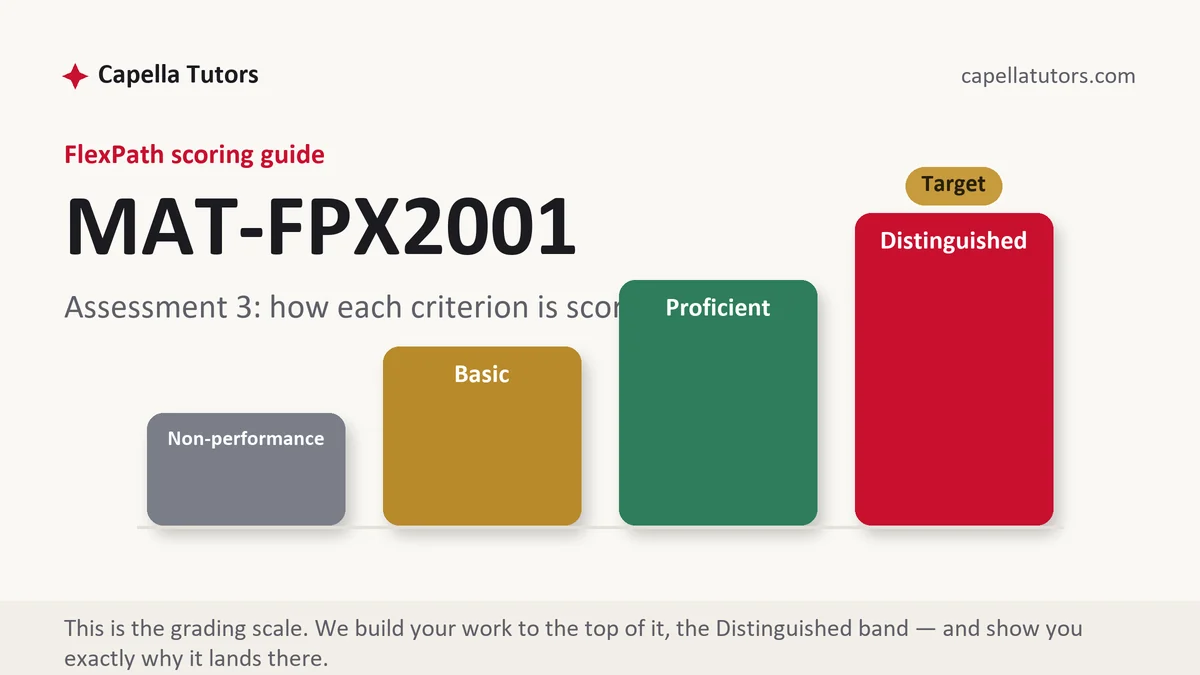
How MAT FPX 2001 Assessment 3 is scored
FlexPath does not use letter grades. Each criterion in the scoring guide lands on one of four levels, and the level descriptions are the real writing brief:
| Level | What it means on a descriptive statistics analysis |
|---|---|
| Distinguished | Statistics are calculated correctly, graphs are appropriate and labeled, the choice of measures is justified by the data's shape, and the interpretation is clear and tied to the question. |
| Proficient | Statistics and graphs are correct, but interpretation is brief. |
| Basic | Numbers are reported with little interpretation or with errors. |
| Non-performance | Required statistics, graphs or interpretation are missing. |
Show your calculations or software output as your guide requires, and label every graph.
The MAT FPX 2001 Assessment 3 method, step by step
-
Describe the data
What was measured, for whom, and the sample size.
-
Calculate center
Mean, median and mode where meaningful.
-
Calculate spread
Range, standard deviation and quartiles.
-
Graph the data
Histograms or box plots for quantitative data, bar charts for categories.
-
Check the shape
Skew and outliers, and which measures they favor.
-
Interpret
What the statistics say about the question, in plain language.
A structure that maps to the criteria
Word counts are planning targets our tutors use, not Capella rules; follow the length and format your scoring guide states.
| Section | What it must do | Guide |
|---|---|---|
| Introduction | The data and the question. | ~75 words |
| Measures of center and spread | Statistics with brief explanation. | ~150 words plus table |
| Graphs | Labeled, appropriate charts. | 1 to 3 graphs |
| Interpretation | What the results mean. | ~150 words |
| Conclusion and references | Close, then references. | ~50 words |
Annotated sample excerpt
An original model excerpt from our team, written to show the register that reaches the top of the guide. Learn the moves, then write your own version.
The mean commute time in the sample is 34 minutes, but the median is 26 minutes, and the histogram shows a long right tail created by a few employees who travel more than 90 minutes.1 Because those outliers pull the mean upward, the median is the better summary of a typical employee's commute, while the standard deviation of 21 minutes shows how widely commutes vary.2 For the question of whether a later start time would help most staff, the median matters more than the mean, since the policy should fit the typical commute rather than the extremes.3
- 1Reports center and notes the skew shown in the graph.
- 2Justifies the better measure and interprets spread.
- 3Connects the statistics to the decision question.
The full premium sample for your exact assessment, written fresh to your scoring guide and topic, is free to request. Study it, revise it into your own voice, and submit work you understand.
The five mistakes that cost Distinguished
- Numbers without meaning. Interpret each statistic.
- Ignoring skew. Choose measures that fit the shape.
- Unlabeled graphs. Title and label every chart.
- Wrong graph type. Match the chart to the data.
- No link to the question. Say what the results mean for it.
Pre-submission checklist
- Data described
- Center and spread calculated correctly
- Appropriate, labeled graphs
- Measures justified by shape
- Clear interpretation
- References as required
Want the descriptive statistics analysis written?
Send the scoring guide and any materials from your courseroom. Our team returns a premium original descriptive statistics analysis in 24 to 48 hours, revised free until it meets the guide.