This manual is for MAT FPX 1150 Assessment 3, start to submission. The third deliverable in this course usually turns on chance rather than on totals. You are handed a decision whose outcome is uncertain, asked to price it, and asked to explain the result to a reader who finds probability slippery. Counts do that job better than notation does. The rest of this page carries our tutors' method, a structure keyed to the rows, and an annotated excerpt. Rather someone else built it? A premium original sample matched to your prompt returns within 24 to 48 hours, revised without charge until the rows clear. Capella's catalog lists the course as MAT-FPX1150, and some courserooms print MAT1150; both point to this same Assessment 3.
One honesty note before the manual: Capella revises courses and scoring guides over time, so always write to the exact scoring guide attached to your assessment in the courseroom. The course identity above is verified on capella.edu; the method and structure below are our tutors' approach to it, not Capella's official rubric text.
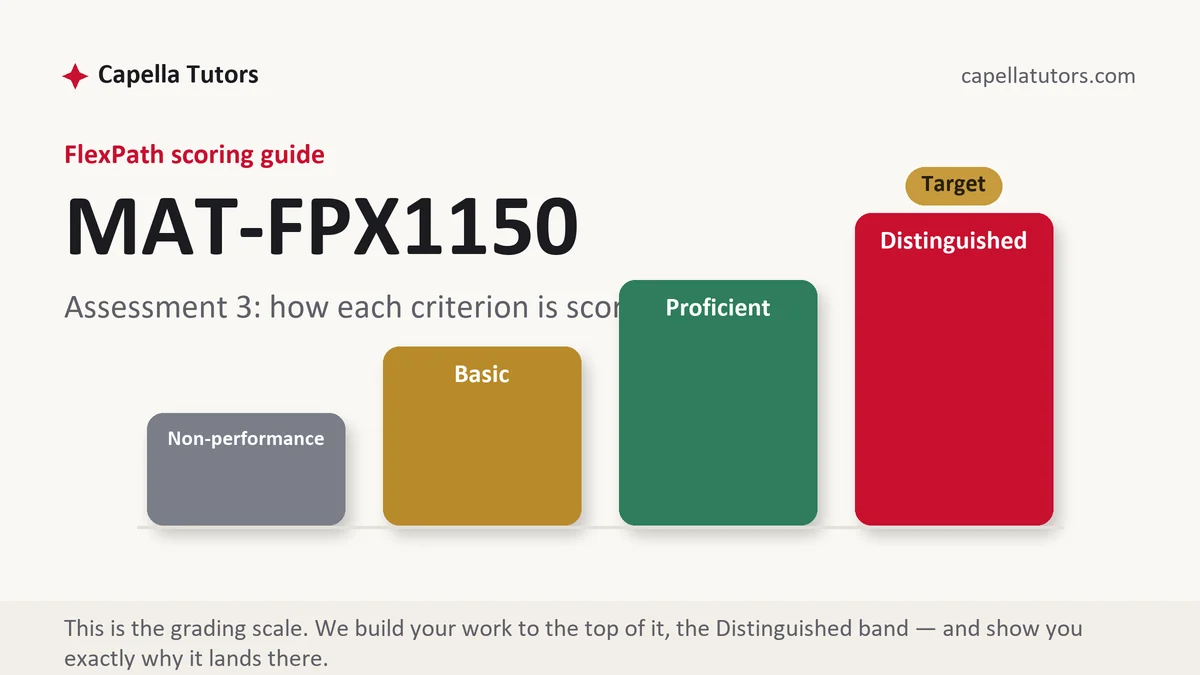
How MAT FPX 1150 Assessment 3 is scored
There is nothing to average in FlexPath. Each criterion is marked at one of four levels, and the words in each level tell you what to produce:
| Level | What it means on a probability and expected value deliverable |
|---|---|
| Distinguished | The chances are stated as counts out of a named group, the expected cost of each option is computed and compared, the break-even chance is found and reported, and the advice admits what a single household cannot know in advance. |
| Proficient | The probabilities and the expected values are right and a choice is made. Correct work, silent about the break-even point. |
| Basic | A probability quoted as a decimal with no group behind it, or an expected value computed and never compared with the alternative. |
| Non-performance | Something the row demanded is not there at all, usually the comparison or the plain-language explanation. Absence sits at the floor. |
Write chances as frequencies wherever you can. Eleven in a hundred is understood on first reading and 0.11 is not, and the communication row in this course is scored against a reader who does not work with decimals for a living.
The MAT FPX 1150 Assessment 3 method, step by step
-
Turn the criteria into headings, audience first
Note who the explanation is for before you compute anything, then give every row its own section. Probability rows almost always pair a calculation with a translation, and the translation is where the marks concentrate.
-
State the outcomes and where the chances came from
List every outcome, its chance, and the source of that chance, whether the prompt supplied it or a published figure did. A probability with no group underneath it cannot be checked and cannot be credited.
-
Rebuild the problem as counts
Scale the chances to a round group, usually a thousand, and write out how many land in each outcome. Working in whole people rather than in decimals prevents most of the errors and produces the sentence the communication row wants.
-
Compute the expected cost of each option
Multiply each outcome by its chance and add, then do the same for the alternative. Put both figures side by side, since an expected value with nothing to compare against answers half the question.
-
Find the point where the answer flips
Solve for the chance that would make the two options cost the same. That single figure is the most useful line in the deliverable, because it tells the reader how wrong the assumption has to be before the advice changes.
-
Advise, and admit what chance does not settle
Expected values describe many buyers, not one, and saying so is part of the answer. Close with the recommendation, the condition that reverses it, and a self-score against every row before you submit.
A structure that maps to the criteria
The counts are what our tutors aim at on a probability task and nothing more official than that; your own guide sets the balance.
| Section | What it must do | Guide word target |
|---|---|---|
| The decision | What is being bought or declined, its price, and the uncertainty that makes it a decision. | ~140 words |
| The chances | Each outcome, its probability, the group it refers to, and where the figure came from. | ~180 words |
| The same problem in counts | The chances scaled to a round group and written out as whole people or whole units. | ~200 words |
| Expected cost of each option | Both options priced across the group, with the arithmetic visible and the totals compared. | ~230 words |
| Break-even and advice | The chance that equalizes the options, the recommendation, and what a single case cannot reveal. | ~200 words |
| Presentation and sources | Currency to cents, any published failure or claim rate cited in current APA with its date. | as needed |
Annotated sample excerpt
A model excerpt from our team, written to the standard the guide's top level sets. Take what it does and do it in your own words.
The washer costs 640 dollars, the three-year extended warranty adds 119 dollars, and the manufacturer's own service data put the chance of a covered repair in that window at about 11 percent, with repairs averaging 240 dollars.1 Out of 1,000 buyers who decline the warranty, roughly 110 pay for a repair and 890 pay nothing, so the group spends about 26,400 dollars, or 26.40 dollars a buyer, against 119,000 dollars if all 1,000 buy the coverage.2 The two options would cost the same only if about 49.6 percent of washers needed a repair, since 119 divided by 240 is 0.496, so the warranty is worth buying only for a machine roughly five times less reliable than this one.3
- 1Each figure arrives with its source in the same sentence, and the repair cost is separated from the repair chance. Both are gradable moves and both are commonly skipped.
- 2The chances are rebuilt as whole buyers before any expected value appears, which makes the comparison legible to the reader the communication row names.
- 3The break-even chance is solved for and read back in plain words. It is the line that turns a correct calculation into advice somebody could act on.
The full premium sample for your exact assessment, written fresh to your scoring guide and issue, is free to request. Study it, revise it into your own voice, and submit work you understand.
The five mistakes that cost Distinguished
- A probability with no group behind it. Eleven percent of what, over how long, is the question a reader asks first and the row asks second.
- One option priced and the other ignored. An expected cost is only meaningful beside the expected cost of doing the other thing.
- Decimals used where counts would read better. The audience named in the prompt understands 110 buyers in a thousand and stalls at 0.11.
- Expected value read as a prediction. It describes a large group, not the machine in one kitchen, and confusing the two is a favorite target of the analysis row.
- No break-even figure anywhere. Without it the advice rests entirely on a rate the reader has no way to test.
Pre-submission checklist
- A heading for every row, and the audience named under the first one
- Every probability reported with its group, its period, and its source
- The chances rewritten as counts out of a round group
- Expected cost computed for both options and compared directly
- The break-even chance solved for and explained in plain words
- A recommendation stating what a single case cannot reveal, every row self-scored
A chance-and-cost decision to write up?
Send the prompt, the criteria, and any rates the assessment supplied. Eight people work the file, ending with an editor who reads it as a non-mathematician would, and one pass exists purely to recompute every figure. Delivery is 24 to 48 hours, aimed at the top column, with free revision until it lands there.