This manual is for HRM FPX 5960 Assessment 2, start to submission. The second stage of the capstone is the baseline and the diagnosis: the current state stated in a measure you defined before you touched anything, then a causal account that keeps what the data shows apart from what you concluded from it. Your scoring guide sets the shape, and the criterion that decides this one is nearly always whether a reader could rebuild your numbers from the page. Below you will find our tutors' method, a structure keyed to the criteria, and an annotated sample excerpt. Would rather hand it over? A premium original sample returns in 24 to 48 hours, revised free until every criterion is satisfied. Capella's catalog lists the course as HRM-FPX5960, and some courserooms print HRM5960; both point to this same Assessment 2.
One honesty note before the manual: Capella revises courses and scoring guides over time, so always write to the exact scoring guide attached to your assessment in the courseroom. The course identity above is verified on capella.edu; the method and structure below are our tutors' approach to it, not Capella's official rubric text.
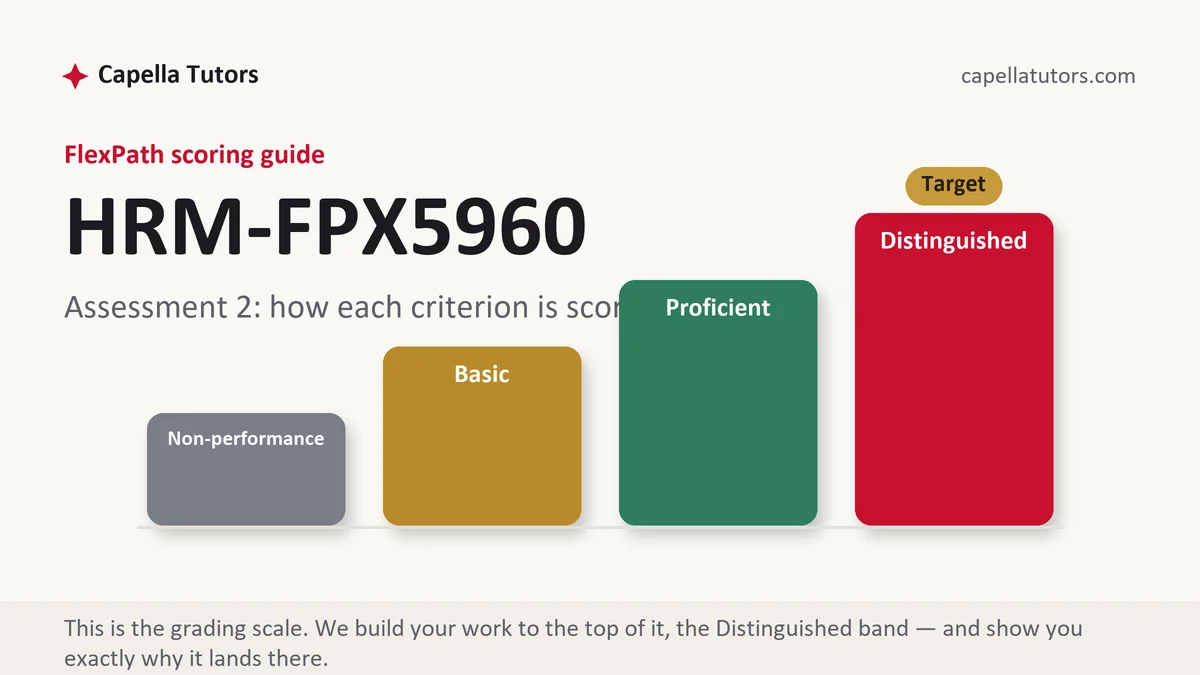
How HRM FPX 5960 Assessment 2 is scored
Four levels, applied criterion by criterion. On a baseline and diagnosis deliverable the columns translate this way:
| Level | What it means on a baseline and diagnosis |
|---|---|
| Distinguished | The metric is defined in writing before it is used, the same underlying data is shown to produce different headlines under different definitions, the rate is split until it points at a mechanism, and the inference is separated from the observation so a reader can reject one and keep the other. |
| Proficient | Accurate figures from a real report, with a plausible causal account attached. The definitional choices are made silently, and silent choices are what the top column will not credit. |
| Basic | A dashboard screenshot in prose. One headline percentage, no denominator stated, and a diagnosis that reads as the writer's prior belief with numbers nearby. |
| Non-performance | A required element is absent, most often the definition or the source, and a figure whose origin the reader cannot locate is treated as no figure at all. |
Hold your definitions steady from here. The evaluator of your later deliverables will check the baseline against this submission, and a measure that quietly changed meaning between stages costs more credit than a measure that was always cautious.
The HRM FPX 5960 Assessment 2 method, step by step
-
Publish one definition and retire the others
Write the formula, the numerator, the denominator, the window and the exclusions, then put it where a reader can find it. Decide in advance whether an internal transfer is a separation, whether a fixed-term end counts, and what happens to someone rehired inside the same year. The definition is the deliverable as much as the number is, because everything after this stage is measured against it.
-
Rebuild the headline three ways to show what the definition costs
The function began the year with 388 people and ended with 416, so average headcount is 402, and there were 74 separations. Against ending headcount that is 17.8 percent, against average headcount 18.4 percent, against beginning headcount 19.1 percent. Same organization, same year, a spread of 1.3 points produced entirely by wording. Show all three once, name the one you will use for the rest of the capstone, and no reader will spend the next section wondering.
-
Split the rate until it points at a mechanism
Of the 74 separations, 51 were voluntary, which is 12.7 percent, and 33 of those the organization would rather have kept, 8.2 percent. Now split by tenure: 24 of the 51 voluntary leavers had under twelve months of service, and that population averaged 63 people, so early turnover ran at 38.1 percent while the remaining 339 employees produced 27 departures, 8.0 percent. One organization, a difference of nearly five times, and only the first figure describes something you can act on this quarter.
-
Handle a short window honestly
Fourteen voluntary separations in one quarter is 3.5 percent of 402, which annualizes to about 13.9 percent, and the annualized figure is the one everybody will quote. Print the window next to it anyway, because separations cluster after bonus payments and after the anniversary of a hiring wave, and this quarter contains both. A number with its window attached survives the meeting; a number without one gets challenged and then discarded.
-
Keep observation and inference in different sections
What the data shows is that early tenure separations concentrate in two departments and that 19 of 33 regretted leavers had never had a documented conversation with a supervisor in their first 60 days. What you concluded is that the absence of that conversation contributes causally. Write those in separate sections, name at least two alternative explanations, and say which piece of evidence would distinguish them. A reader who can disagree with your inference and keep your data will trust both more.
-
Check the boundaries, then self-score and submit
Two boundaries matter here. Exit interview themes come from people who chose to speak, so they describe volunteers rather than leavers, and the diagnosis should say so once. And if regretted turnover concentrates in a group protected under Title VII of the Civil Rights Act of 1964, the analysis has moved into legal territory and belongs with counsel before it belongs in a dashboard. Then score each criterion yourself and put the attempt up early in the week.
A structure that maps to the criteria
Word targets below are our tutors' planning ranges for a baseline and diagnosis of this scale rather than Capella requirements; widen whichever section your guide weights hardest.
| Section | What it must do | Guide |
|---|---|---|
| Measure and definition | The formula, numerator, denominator, window and exclusions, plus the report the data is pulled from. | ~250 words |
| The baseline stated | The current state computed under the published definition, with the alternative definitions shown once for comparison. | ~300 words |
| Disaggregation | The rate split by tenure, department and voluntary status, until a figure appears that names a mechanism. | ~300 words |
| What the data shows | Observation only, including what people said, with counts of independent sources rather than paraphrase. | ~250 words |
| What you conclude | The causal account, the alternative explanations, and the evidence that would separate them. | ~250 words |
| Limits and references | Self-selection, short windows, legal boundaries, then current APA with internal reports named by title and date. | ~200 words |
Annotated sample excerpt
Original model work from our team, published so the moves that earn the top column are visible on the page. Copy the sequence, not the sentences.
Turnover in this capstone means separations of any kind divided by average headcount for the same twelve months, drawn from the monthly workforce report, with internal transfers excluded and reported separately; on that definition the function ran 74 separations against an average headcount of 402, or 18.4 percent.1 The same 74 separations produce 17.8 percent against ending headcount and 19.1 percent against beginning headcount, which is why the definition is printed before the figure rather than after it.2 Disaggregated, the 51 voluntary separations divide into 24 from a first-year population averaging 63 people, 38.1 percent, and 27 from the remaining 339, 8.0 percent, so the function does not have a turnover problem so much as a first-year problem inside an otherwise stable group.3
- 1Formula, source report and exclusion rule land before the number, so the baseline cannot be renegotiated in a later deliverable.
- 2Shows what the definitional choice is worth in points. Demonstrating the sensitivity is more persuasive than asserting that definitions matter.
- 3Splits until the finding changes the diagnosis, then states the reframing in one sentence a sponsor can repeat.
The full premium sample for your exact assessment, written fresh to your scoring guide and issue, is free to request. Study it, revise it into your own voice, and submit work you understand.
The five mistakes that cost Distinguished
- One headline rate, no denominator. A percentage whose base a reader cannot identify is an opinion with a decimal point in it.
- A pooled figure treated as the finding. Averaging a first-year population together with long-tenured staff hides the only mechanism you could fund.
- Annualizing a quarter in silence. Short windows magnify noise and cluster around bonus dates and hiring anniversaries, so the window belongs beside the number.
- Exit themes read as the voice of leavers. Exit data comes from people who agreed to talk, and the diagnosis should name that limit once and move on.
- Observation and inference in the same paragraph. If a reader cannot tell where the data stops and the writer starts, neither half can be evaluated.
Pre-submission checklist
- The metric definition written out, with exclusions and edge cases decided before the number appears
- The headline rebuilt under at least two alternative denominators, and the working definition named
- Rates split by tenure, department and voluntary status, with counts printed alongside percentages
- Any annualized figure carrying the window it was measured over
- Observation and inference in separate sections, with two alternative explanations named
- Self-selection and legal boundaries stated once, internal reports cited by title and date, submitted early in the week
Baseline due and the definitions disagree?
Send the criteria and whatever workforce extract you can share, even a rough one. Our eight-person pipeline, analyst through double QA, returns a premium original sample in 24 to 48 hours with the definition published, the rate disaggregated and the inference kept apart from the observation, then keeps those numbers aligned with your other capstone submissions.