This manual is for HIM FPX 4650 Assessment 2, start to submission. Assessment 2 asks the question the first stage sets up: why the number looks the way it does, and what change the answer justifies. The assessment usually asks for an analysis of causes using a recognized method plus an improvement supported by information systems, which means a criterion asking for root cause analysis is asking for a technique and its output rather than for a conclusion that sounds like one. Below is the method our tutors use for it, a structure that maps to the criteria, and an annotated sample excerpt. Prefer to hand it off? A premium original sample for this exact assessment comes back in 24 to 48 hours, revised free until it meets the guide. Capella's catalog lists the course as HIM-FPX4650, and some courserooms print HIM4650; both point to this same Assessment 2.
One honesty note before the manual: Capella revises courses and scoring guides over time, so always write to the exact scoring guide attached to your assessment in the courseroom. The course identity above is verified on capella.edu; the method and structure below are our tutors' approach to it, not Capella's official rubric text.
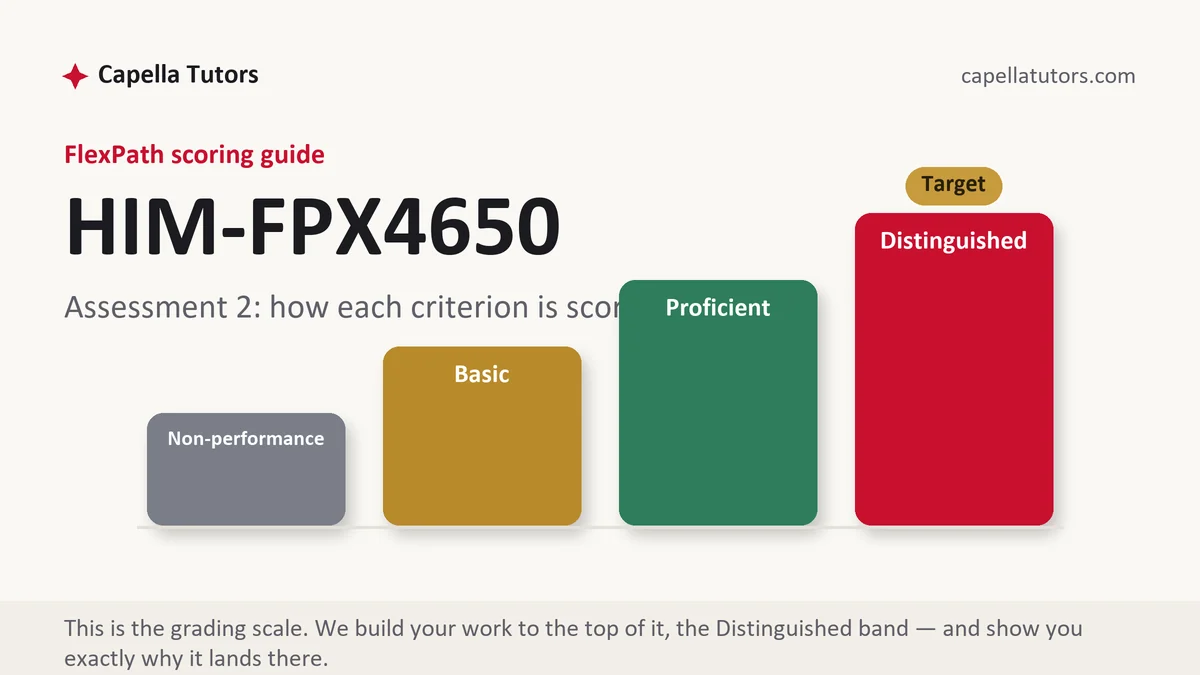
How HIM FPX 4650 Assessment 2 is scored
Each criterion in the guide lands on one of four levels, independently of the others. The top level describes the extra move, and the move is nearly always concrete:
| Level | What it means on a cause analysis and improvement |
|---|---|
| Distinguished | A named technique applied properly, its output shown, contributors ordered by how much volume they carry, and an intervention aimed at the largest one with the extra work it creates acknowledged. |
| Proficient | Plausible causes identified and a sensible change proposed. Complete, and silent about which cause matters most or what the change costs. |
| Basic | Causes listed from intuition, with the first plausible answer treated as the explanation. Frequent when no method was used at all. |
| Non-performance | No analytical method appears, or the improvement is described with no link back to the causes that were found. |
The habit that lifts this deliverable is counting before concluding. A cause with a number beside it can be ranked, funded and monitored. A cause offered as an opinion can only be agreed with, and the criteria are written to notice the difference.
The HIM FPX 4650 Assessment 2 method, step by step
-
Rebuild the outline from the criteria, in their order
Lift the rows of the guide into headings and keep them in sequence, since evaluators read with the guide open beside the paper. Then note the verb each row uses, because analyze, evaluate and recommend buy different work and a paragraph aimed one level below the verb caps the row before the prose is read.
-
Restate the measure and the gap in three lines
Carry the definition forward from your baseline work rather than assuming the reader remembers it: the numerator, the denominator, the period, the current rate and the target. This paper spends its length on causes, so the setup has to be compact, and every figure in it must match the earlier figures exactly.
-
Choose a method and show its output
A cause and effect diagram sorts contributors into people, process, technology, environment and materials so the analysis does not stop at the first answer. Five whys pushes past the symptom. A Pareto ordering shows which two or three categories carry most of the volume, which is what makes a small intervention worth funding. Name the technique, then reproduce what it produced.
-
Count the failures by category
Take the cases that missed and sort them into reasons, then report each reason as a count and a share of the total. Ordering by volume changes what you recommend, because the category everybody talks about is often third on the list, and an intervention aimed at a small category cannot move the rate however well it works.
-
Design the change where the work actually happens
Say what changes, who does it differently, and what information reaches them at the moment they act. A report that arrives next month and a prompt inside the workflow are not the same intervention. If the change depends on somebody noticing something, say where the notice appears and what a non-response rate would tell you about whether the design is working.
-
Cost it, then self-score and submit with slack
Name the hours the change consumes and whose hours they are, because a plan that needs weekly manual chart review will be abandoned by the third month and an evaluator who has worked in a department knows it. Then mark yourself against each criterion and submit early in the week, since two business days per attempt plus one revision is the real timeline.
A structure that maps to the criteria
These are planning targets our tutors use for an analysis of this kind rather than Capella limits; follow your scoring guide where it asks for more.
| Section | What it must do | Guide |
|---|---|---|
| The gap restated | Measure, definition, period, current rate and target, carried forward consistently. | ~150 words |
| Method | The analytical technique chosen, why it fits the problem, and how it was applied. | ~200 words |
| Findings | Contributors with counts and shares, ordered by the volume each one carries. | ~325 words |
| The intervention | What changes, for whom, and the information that reaches them as they act. | ~300 words |
| Feasibility and cost | Hours consumed, whose hours, and what could make the change fail in practice. | ~200 words |
| Next measurement and references | What will be remeasured, when, by whom, with current APA in text and list. | ~150 words |
Annotated sample excerpt
An original model paragraph from our team, showing what a counted cause analysis reads like. Take the structure and apply it to your own data.
Of the 1,340 patients on the Westmark diabetes registry, 412 had no hemoglobin A1c result on file for the twelve months ending in March, and a Pareto ordering of those 412 records sorted them into six reasons.1 Three categories carried 81 percent of the volume: 168 patients had no visit to any network clinic during the period, 96 had a test ordered that was never drawn, and 71 were drawn at an outside laboratory whose result never reached a filed field in the record.2 The third category is the one an information system can close without a clinician changing anything, and it is the reason the intervention proposed below targets result filing before it targets outreach, even though outreach is the category the committee raised first.3
- 1The population, the failures and the method arrive in one sentence, with the period attached. The reader knows the size of everything before any cause is named.
- 2Counts and a combined share, so the ordering is visible rather than asserted. This is what a Pareto is for, and reproducing its output is what the criterion pays for.
- 3Chooses a target from the evidence and says plainly that it differs from the committee's instinct. Ranking causes and then acting on the ranking is the top-column move.
The full premium sample for your exact assessment, written fresh to your scoring guide and issue, is free to request. Study it, revise it into your own voice, and submit work you understand.
The five mistakes that cost Distinguished
- A method named but never shown. Mentioning a technique without reproducing its output leaves the criterion asking for analysis unanswered.
- Causes without counts. An unranked list cannot tell anybody which change would move the rate, so the recommendation becomes a guess.
- An intervention aimed at the smallest category. Fixing a reason that explains six percent of failures cannot produce the improvement the paper promises.
- Information delivered nowhere near the decision. A monthly report cannot influence a choice somebody makes on a Tuesday morning at a workstation.
- Effort left uncounted. A plan whose burden is never stated reads as untested, and the reader who would carry it can tell at a glance.
Pre-submission checklist
- Sections follow the criteria in the guide's own order
- Measure and period restated so every figure matches the baseline work
- A recognized method named, applied and its output reproduced
- Contributors reported as counts and shares, ordered by volume
- The intervention placed where the decision happens, with its burden stated
- What gets remeasured, when and by whom, in current APA throughout
Cause analysis due with no idea where to start?
Send the criteria, your baseline figures and any list of failed cases you can share. We sort the failures into categories, count them, and build the intervention against the largest one rather than the loudest. Eight people between the brief and the file, premium original sample in 24 to 48 hours, revisions free.