This manual is for HIM FPX 4630 Assessment 3, start to submission. Assessment 3 is the comparison deliverable, and the assessment usually asks whether a difference between two groups or two periods is real, then asks what the answer licenses you to claim. The test itself takes a minute in a spreadsheet. What earns the criteria is the sentence afterwards, where a difference is separated from a difference that matters. Below is the method our tutors use for it, a structure that maps to the criteria, and an annotated sample excerpt. Prefer to hand it off? A premium original sample for this exact assessment comes back in 24 to 48 hours, revised free until it meets the guide. Capella's catalog lists the course as HIM-FPX4630, and some courserooms print HIM4630; both point to this same Assessment 3.
One honesty note before the manual: Capella revises courses and scoring guides over time, so always write to the exact scoring guide attached to your assessment in the courseroom. The course identity above is verified on capella.edu; the method and structure below are our tutors' approach to it, not Capella's official rubric text.
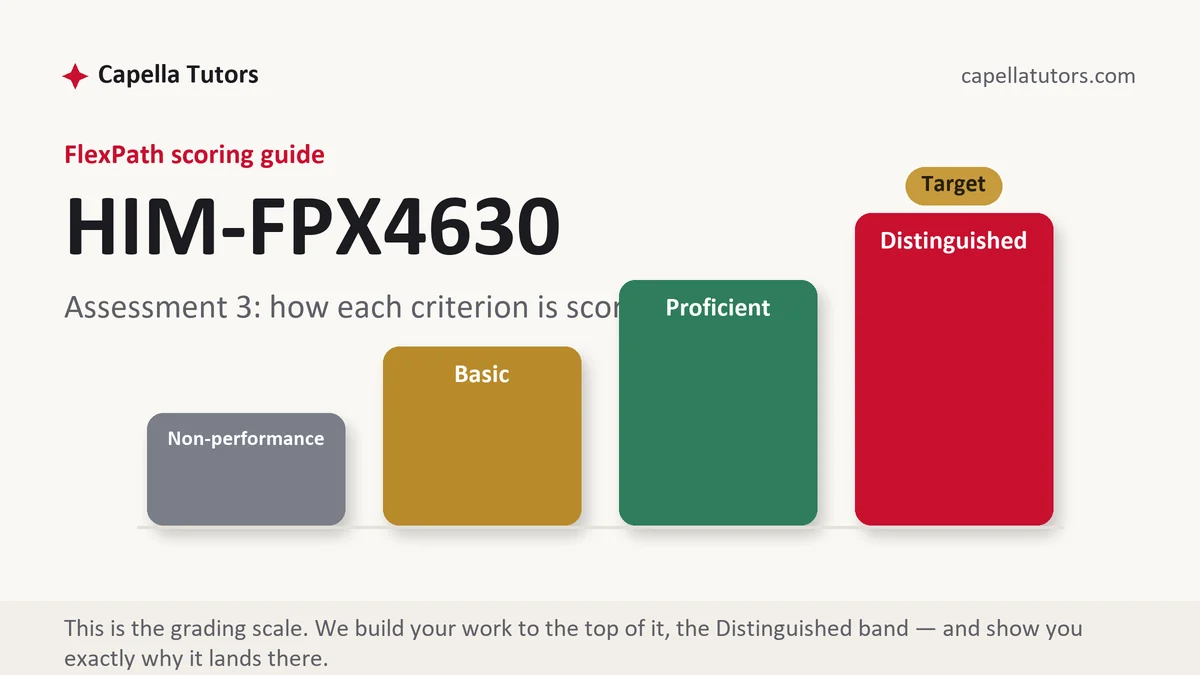
How HIM FPX 4630 Assessment 3 is scored
Every criterion in FlexPath resolves to one level, and no criterion is rescued by a strong one next to it. Read the top level as the specification for each section:
| Level | What it means on a comparison of two groups |
|---|---|
| Distinguished | The groups are shown to be comparable, the test suits the data, the assumption behind it is stated, and the result is reported with the size of the difference beside it and a plain sentence on what it permits you to claim. |
| Proficient | The right test, run correctly, reported accurately. Complete work that stops before saying whether the difference is worth acting on. |
| Basic | A test result offered as proof, or two rates compared with no attention to whether the groups were alike to begin with. |
| Non-performance | The comparison or its interpretation is missing, or a stated assumption of the test was never addressed anywhere in the paper. |
One idea carries this deliverable. A test tells you whether a difference is likely to be real; it says nothing about whether the difference is large enough to change what a department does. The paper that earns the top column answers both questions, usually in a single sentence.
The HIM FPX 4630 Assessment 3 method, step by step
-
Outline from the criteria and write the question as a question
Headings first, straight from the guide. Then state what you are testing in one plain sentence, naming both groups and the measure. A comparison written down as a question is easy to answer; a comparison carried in your head drifts, and the paper ends up reporting three things and concluding none of them.
-
Establish that the groups can be compared at all
Before any test, say what the two groups have in common and where they differ. Different patient mix, different months, different counting rules or different eligibility all break the comparison, and the honest response is to narrow it until it holds. A test run on groups that were never alike produces a confident number about nothing.
-
Choose the test from the shape of the data
Counts falling into categories point to a chi-square. Two group means point to a t-test. Two measured variables moving together point to a correlation. Name the test, name the assumption it rests on, and say in one line whether your data meets it. That line is a criterion in most guides and it is usually the cheapest one on the page.
-
Report the effect and the test in the same breath
Give both rates with their bases, the absolute difference between them, then the test statistic and the probability. Three percentage points and a probability of 0.29 tell a complete story together and neither tells it alone. Small denominators are the trap here, because a handful of cases moves a percentage by a full point and no test can compensate for a base that was too small to begin with.
-
Say what the result licenses, then what it does not
Two measures moving together is a finding. One causing the other is a claim that needs a design capable of supporting it, and observational data from a records system almost never is. Write the boundary yourself rather than leaving a reader to find it, and name the data that would settle the question if somebody collected it.
-
Attach the workbook and submit with time to fix one thing
Build the calculation in cells so the formula bar shows a reviewer what you divided by what, keep the raw data on its own sheet, and check whether your guide wants the file submitted alongside the paper. Then submit early in the week, because two business days of evaluation plus one correction is the honest arithmetic of finishing a course on time.
A structure that maps to the criteria
Our tutors' planning targets for a comparison of this size, not Capella rules; expand wherever your scoring guide asks for more.
| Section | What it must do | Guide |
|---|---|---|
| Question and measure | The comparison stated plainly, with the measure and both groups named. | ~150 words |
| Groups and comparability | What the groups share, where they differ, and how the comparison was narrowed to hold. | ~250 words |
| Method | The test chosen, why it fits the data, and the assumption it depends on. | ~200 words |
| Results | Both rates with bases, the absolute difference, the statistic and the probability. | ~275 words |
| Interpretation and limits | What the result supports, what it cannot, and the practical size of the difference. | ~300 words |
| Exhibits and references | A labeled table of the comparison, and definitional sources in current APA. | ~150 words |
Annotated sample excerpt
An original model paragraph from our team, showing how a result that fails to reach significance is still written up as a finding. Learn the moves and apply them to your own data.
Among patients discharged from the medical unit between January and March, 18 of the 214 who received a telephone follow-up within two days returned within 30 days, a rate of 8.4 percent, against 27 of the 236 who received the mailed summary alone, or 11.4 percent.1 The absolute difference is 3.0 percentage points, and a chi-square test of the two-by-two table gives 1.14 with one degree of freedom and a probability of 0.29, so the data do not support a claim that the follow-up call reduced returns.2 With 45 events across 450 discharges, a difference this size was unlikely to reach significance whatever the call achieved, and the practical response is to extend the observation window rather than to abandon the program on three months of counts.3
- 1Both numerators, both bases and both rates, with the period stated once. A reader can rebuild the table from this sentence alone.
- 2The size of the difference comes first, the test second, and the conclusion is stated as what the data do not support rather than as a claim of no effect.
- 3Names the real limitation, which is the number of events, and turns it into a recommendation. This is the move that separates the top two columns on the interpretation rows.
The full premium sample for your exact assessment, written fresh to your scoring guide and issue, is free to request. Study it, revise it into your own voice, and submit work you understand.
The five mistakes that cost Distinguished
- Groups compared without checking they are alike. Two rates from unlike populations describe the populations, not the intervention.
- A probability reported alone. Without the size of the difference beside it, no reader can tell whether the finding matters to anyone.
- No significant difference read as no difference. A small sample that failed to detect an effect has not demonstrated the absence of one.
- Correlation written as cause. Records data supports a claim about association and rarely supports one about mechanism.
- Assumptions never mentioned. A test applied without naming what it requires of the data leaves an easy criterion unanswered.
Pre-submission checklist
- Every criterion has a section you can point to
- The comparison stated as one plain question, both groups named
- Comparability addressed before the test is run
- Test named, assumption stated, and its fit to the data explained
- Both rates with bases, the absolute difference, the statistic and the probability
- A limit on what the result supports, workbook prepared if the guide asks for it
A comparison due and no confidence in the test?
Send the file as your course supplied it, the prompt and the criteria. We choose the test from the shape of your data, run it twice with two readers, and write the interpretation so that the claim never travels further than the evidence. Workbook with visible formulas included, in 24 to 48 hours.