This manual is for HIM FPX 4630 Assessment 2, start to submission. Assessment 2 moves past counting into describing, and the assessment usually asks for central tendency and spread on a health information data set plus an interpretation written for a named audience. The measures are ordinary. What is graded is whether you noticed the shape of the distribution, reported the average that fits it, and told a manager something they can use. Below is the method our tutors use for it, a structure that maps to the criteria, and an annotated sample excerpt. Prefer to hand it off? A premium original sample for this exact assessment comes back in 24 to 48 hours, revised free until it meets the guide. Capella's catalog lists the course as HIM-FPX4630, and some courserooms print HIM4630; both point to this same Assessment 2.
One honesty note before the manual: Capella revises courses and scoring guides over time, so always write to the exact scoring guide attached to your assessment in the courseroom. The course identity above is verified on capella.edu; the method and structure below are our tutors' approach to it, not Capella's official rubric text.
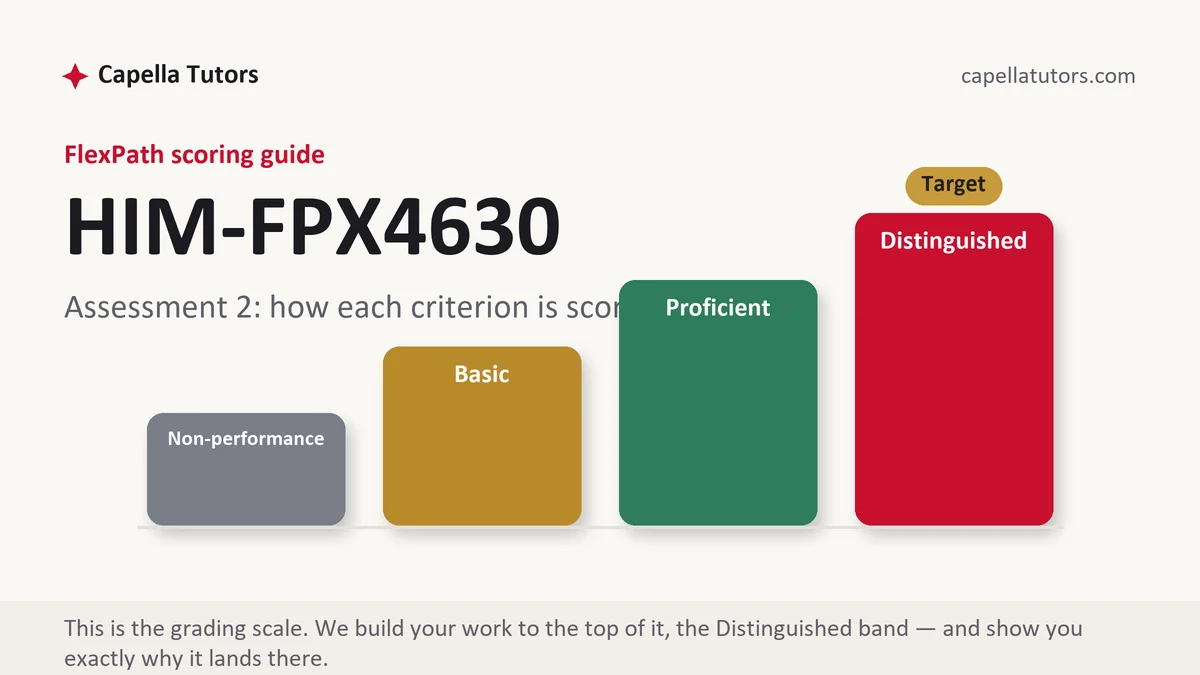
How HIM FPX 4630 Assessment 2 is scored
Criteria, not points, decide FlexPath work, and each one settles on a single level. The language of the top level is the most precise writing instruction you will get:
| Level | What it means on a descriptive analysis |
|---|---|
| Distinguished | Mean and median reported together wherever the distribution is skewed, the headline figure justified, and the spread used to say how much confidence the reader should place in it. |
| Proficient | Correct descriptive statistics, correctly labeled, summarized accurately. Right, and quiet about which figure the reader should act on. |
| Basic | A mean reported alone for a distribution with a long tail, or software output pasted in with a general comment beneath it. |
| Non-performance | A measure the criterion asked for is not present, or the interpretation section never addresses the audience the prompt named. |
The move that lifts this deliverable is small and almost nobody makes it. Report both averages, then write one sentence explaining the gap between them. That sentence is usually the operational story, and it is what a department manager reads the report for.
The HIM FPX 4630 Assessment 2 method, step by step
-
Convert the criteria into headings, and note the audience beside each
Write the criteria down the page first. Then put the reader the prompt named next to the interpretation rows, because a paragraph pitched at a statistician and the same paragraph pitched at a department manager are different paragraphs, and one of them answers the criterion.
-
Look at the distribution before you compute anything
Sort the values and glance at the ends. Elapsed times, lengths of stay and turnaround times all pile up at the low end and trail out at the high end, because nothing takes less than zero minutes while a few cases take all day. Knowing the shape first tells you which average to lead with and stops you defending a figure the data cannot support.
-
Report central tendency and spread as a pair
An average with no spread beside it hides how much the process moves. Give the mean, the median, the range and the standard deviation, and if the mode matters in your data say why. Then choose the headline figure openly: the median for a skewed operational measure, the mean where a benchmark is expressed that way, and either where the two sit close together.
-
Explain the gap between mean and median in one sentence
When the mean runs well above the median, a small group of long cases is carrying your average, and that group is the finding. Name it. A report that says the mean is pulled by 40 cases waiting on an outside result has told a manager where to look, and that is what the interpretation criterion is buying.
-
Attach a base to every rate in the report
A count of cases that left before being seen invites the wrong question. The same count against the visits recorded in the same month answers it before it is asked. Keep the numerator and the denominator on the same population and the same window, because that mismatch is invisible on rereading and obvious to anybody who recomputes.
-
Self-score against the guide, then submit with slack
Mark yourself at each level on every criterion and rewrite anything you cannot defend at the top. Then submit early enough in the session that a revision cycle fits, since each attempt can sit with an evaluator for two business days before you learn anything.
A structure that maps to the criteria
Planning targets from our tutors for a descriptive report, not Capella limits; grow whichever section your scoring guide leans on hardest.
| Section | What it must do | Guide |
|---|---|---|
| Purpose and reader | The question, the audience the prompt named, and the decision in front of them. | ~125 words |
| Data and preparation | Source, period, what one record is, records removed, and the analyzed count. | ~200 words |
| Descriptive results | Central tendency and spread for each measure, with the distribution's shape described. | ~325 words |
| Rates in context | Any rate with its numerator, denominator and period, plus the comparison you chose. | ~250 words |
| Interpretation for the reader | What to act on, what the spread implies, and the limits of the data in plain terms. | ~275 words |
| Exhibits and references | Charts with labeled axes and case counts, definitional sources in current APA. | ~150 words |
Annotated sample excerpt
An original model paragraph from our team, showing how a skewed measure reads when the writer has understood the shape. Take the structure and write your own.
Across the 4,712 emergency visits recorded at Grantham in March, the median interval from arrival to provider evaluation was 34 minutes, while the mean was 51 minutes and the standard deviation 46 minutes.1 The gap between the two averages is the report's main finding rather than an error: 268 visits waited longer than two hours, and 191 of those arrived between four and eight in the evening, which is where the long tail comes from.2 Over the same month 143 patients left before being seen, or 3.0 percent of the 4,712 visits, and that rate is reported against visits rather than against arrivals so it stays comparable with the department's own monthly series.3
- 1Median, mean and spread in one sentence, with the case count first. The reader knows the size of the sample before any average is offered.
- 2Explains the gap and locates it in a specific group of visits and hours. This is the sentence a manager acts on, and it is the one most submissions leave out.
- 3Rate with numerator, base and period, plus a stated reason for the choice of base. Comparability is claimed and justified in the same breath.
The full premium sample for your exact assessment, written fresh to your scoring guide and issue, is free to request. Study it, revise it into your own voice, and submit work you understand.
The five mistakes that cost Distinguished
- A lone mean on skewed data. Reporting the average without the median hides the long tail that a manager actually needs to see.
- Spread omitted. Central tendency with no range or standard deviation beside it tells a reader nothing about how much the process moves.
- Software output pasted whole. A block of results with no sentence saying what it means leaves the interpretation rows empty.
- The wrong reader. An interpretation written in statistical language for a prompt that named an operations manager misses the criterion by aiming past it.
- Outliers deleted quietly. Removing inconvenient values without reporting the removal turns a data quality decision into something a reader cannot check.
Pre-submission checklist
- Each criterion answered under its own heading
- Distribution shape described before any average is defended
- Mean, median and spread reported together, with the headline figure justified
- One sentence explaining the gap between mean and median
- Every rate carrying its numerator, denominator and period
- Interpretation written to the audience the prompt named, in current APA throughout
Descriptive analysis due for a reader who is not a statistician?
Send the untouched data file, the prompt and the criteria. Two people compute independently, a reviewer reads the draft against your guide and nothing else, and the interpretation gets written for the audience your prompt named. Premium original sample in 24 to 48 hours, revisions free until the criteria are met.