This manual is for HIM FPX 4630 Assessment 1, start to submission. Assessment 1 is where the standard health care statistics get computed, and the assessment usually hands you a data set or a set of counts and asks for specified utilization measures plus a short written report for a stated reader. The arithmetic is division. The grade is whether you divided by the accepted base, said which base it was, and wrote a sentence a committee could act on. Below is the method our tutors use for it, a structure that maps to the criteria, and an annotated sample excerpt. Prefer to hand it off? A premium original sample for this exact assessment comes back in 24 to 48 hours, revised free until it meets the guide. Capella's catalog lists the course as HIM-FPX4630, and some courserooms print HIM4630; both point to this same Assessment 1.
One honesty note before the manual: Capella revises courses and scoring guides over time, so always write to the exact scoring guide attached to your assessment in the courseroom. The course identity above is verified on capella.edu; the method and structure below are our tutors' approach to it, not Capella's official rubric text.
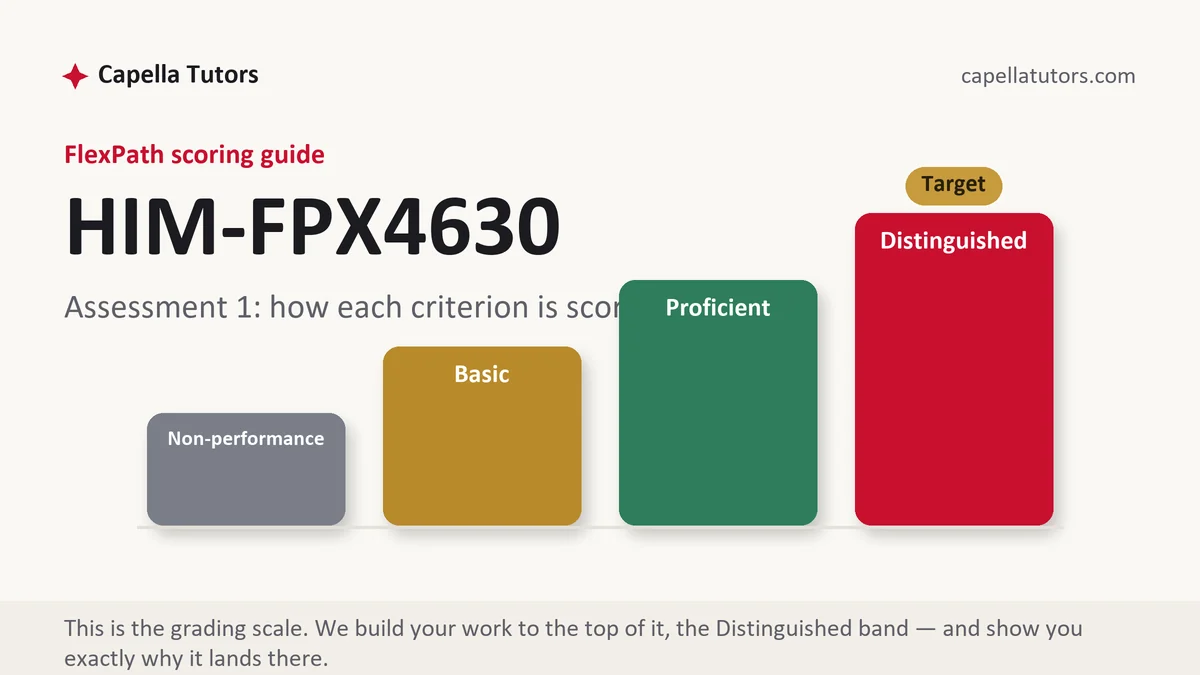
How HIM FPX 4630 Assessment 1 is scored
FlexPath grades criteria, not papers, and each criterion lands on one of four levels. The level you want is written out in the guide, so read it as an instruction:
| Level | What it means on a utilization statistics report |
|---|---|
| Distinguished | Formulas named, bases stated, working shown, and every figure carrying its period. The interpretation says what the numbers mean for the department and where they stop being reliable. |
| Proficient | Correct computations, correctly labeled, with an accurate summary underneath them. Everything is right and nothing has been decided. |
| Basic | Numbers that arrive without their formula or their base, or a table left to speak for itself. This is the standard shape of a first attempt. |
| Non-performance | A required measure or the written interpretation is absent. A blank row scores at the floor regardless of how good the rest is. |
Worth knowing early: the interpretation rows are usually worth as much as the calculation rows and take a tenth of the effort. Students who lose points in this course almost always lost them after the arithmetic was finished.
The HIM FPX 4630 Assessment 1 method, step by step
-
Read the guide, then the data dictionary, then the data
Put each criterion into your document as a heading before you open the file. Then find out what one row of the data represents, because a file where one row is a patient and a file where one row is a visit produce different denominators from identical arithmetic, and nothing later in the paper can recover from getting that wrong.
-
Write the parameters of the period down once
Days in the period, beds in service, the facility and the unit of analysis go in a short block near the top of the results. Every later figure depends on them, and stating them once means you never have to recompute a denominator halfway down the page or explain a mismatch a reader has already noticed.
-
Count what you started with and what you analyzed
Report records received, records removed, the reason for each removal, and the number that survived. A blank cell is not a zero, a duplicated row moves an average without announcing itself, and an impossible value is an entry error until somebody proves otherwise. Three lines of that trail satisfy a data quality criterion more convincingly than a page of assurances.
-
Use the accepted base for each measure and name it
Service days over days in the period gives average daily census. Service days over beds multiplied by days gives occupancy. Discharge days over discharges gives average length of stay, counting the day of admission and not the day of discharge. Write the formula, then the values you put in it, then the result with its unit. A reader who can reproduce your figure will not challenge it.
-
Present the numbers so a table could stand alone
Label both axes and put the number of cases in the caption. Round consistently and say where you rounded, since a rate carried to four decimals out of a small denominator advertises that sample size never came up. Use a table when a reader will look up an exact value and a chart when the point is a comparison over time.
-
Write the finding above the table, then submit early in the week
One sentence saying what the reader should take from each exhibit is the difference between handing over data and delivering an analysis. Then submit with days to spare. Evaluation runs up to two business days per attempt, and a workbook that needs one correction is far cheaper to fix on a Tuesday than on the last afternoon of your session.
A structure that maps to the criteria
The lengths below are our tutors' planning targets for a report of this kind rather than Capella rules, and any section your guide weights heavily should grow.
| Section | What it must do | Guide |
|---|---|---|
| Purpose and audience | The question being answered, who asked for it, and the decision the figures inform. | ~125 words |
| Data and period | Source, reporting period, what one record represents, beds in service, and any exclusions. | ~175 words |
| Preparation | Records received, removed and analyzed, with a reason attached to every removal. | ~175 words |
| Calculations | Each formula, the values entered, and the result with its unit and its base. | ~350 words |
| Interpretation | What the figures mean for the reader, what they cannot settle, and the comparison used. | ~275 words |
| Exhibits and references | Labeled tables and charts, rounding stated, and definitional sources cited in current APA. | ~150 words |
Annotated sample excerpt
An original model paragraph from our team, written to show how computed figures read when the working is visible. Study the moves, then run your own numbers the same way.
Grantham Community Hospital operated 168 beds throughout the 91 days of the quarter, giving 15,288 bed days available, and the daily census reports totaled 11,466 inpatient service days.1 Average daily census is therefore 11,466 divided by 91, or 126.0 patients, and percentage of occupancy is 11,466 divided by 15,288, or 75.0 percent for the quarter.2 Average length of stay uses a different base: 11,242 discharge days divided by 2,285 discharges gives 4.92 days, counting the day of admission and not the day of discharge, and it is computed on discharges rather than on admissions so that only completed stays are included.3
- 1Establishes the two quantities every later figure divides by, in the same sentence as the period. Nothing downstream can be miscalculated without the reader seeing it.
- 2Formula, inputs and result in one line each, with the unit attached. A faculty member recomputing this lands on the same number and moves on.
- 3Flags that the base changed and says why. Naming the counting rule for the day of discharge is the detail that separates a student who learned the formula from one who understands it.
The full premium sample for your exact assessment, written fresh to your scoring guide and issue, is free to request. Study it, revise it into your own voice, and submit work you understand.
The five mistakes that cost Distinguished
- The wrong denominator. A rate computed against discharges where the accepted base is patient days or bed days matches no published figure anywhere.
- Length of stay divided by admissions. Discharge days belong over discharges, and this substitution produces a plausible wrong answer that reads as correct.
- Results with no period. A percentage that could describe a month or a quarter cannot be compared with anything, and the reader has no way to notice.
- Rounding as decoration. Four decimals out of a two-digit denominator claims a precision the data does not hold.
- A table left to interpret itself. The interpretation criteria pay whoever did the interpreting, and a table alone hands that work to the reader.
Pre-submission checklist
- Every criterion has its own labeled section in the document
- Period, beds in service and unit of analysis stated once, near the top
- Records received, removed and analyzed, each removal with a reason
- Each formula written out with its inputs, its result and its unit
- Exhibits labeled with units and case counts, rounding stated
- One interpreting sentence above every table, in current APA throughout
Numbers due and the file is a mess?
Send the data exactly as your course supplied it rather than retyped, plus the prompt and the criteria. Every figure gets computed twice by two people, and anything the two passes disagree on is rebuilt from the raw file. You receive the workbook with formulas visible alongside the written report, in 24 to 48 hours.