This manual is for EDD FPX 8524 Assessment 2, start to submission. Assessment 2 usually asks you to project, and a projection is only defensible when a reader can rebuild it. That means a stated horizon, a stated unit, a base year, a rate, and the arithmetic visible on the page, followed by what the number does to buildings, staffing and money. Check your own guide for the form the deliverable takes and the reader it is written for. The method comes next, followed by a section plan tied to the criteria and an annotated excerpt. Rather hand it over? Send us the guide and a premium original sample is back with you in 24 to 48 hours, revised at no charge. Capella's catalog lists the course as EDD-FPX8524, and some courserooms print EDD8524; both point to this same Assessment 2.
One honesty note before the manual: Capella revises courses and scoring guides over time, so always write to the exact scoring guide attached to your assessment in the courseroom. The course identity above is verified on capella.edu; the method and structure below are our tutors' approach to it, not Capella's official rubric text.
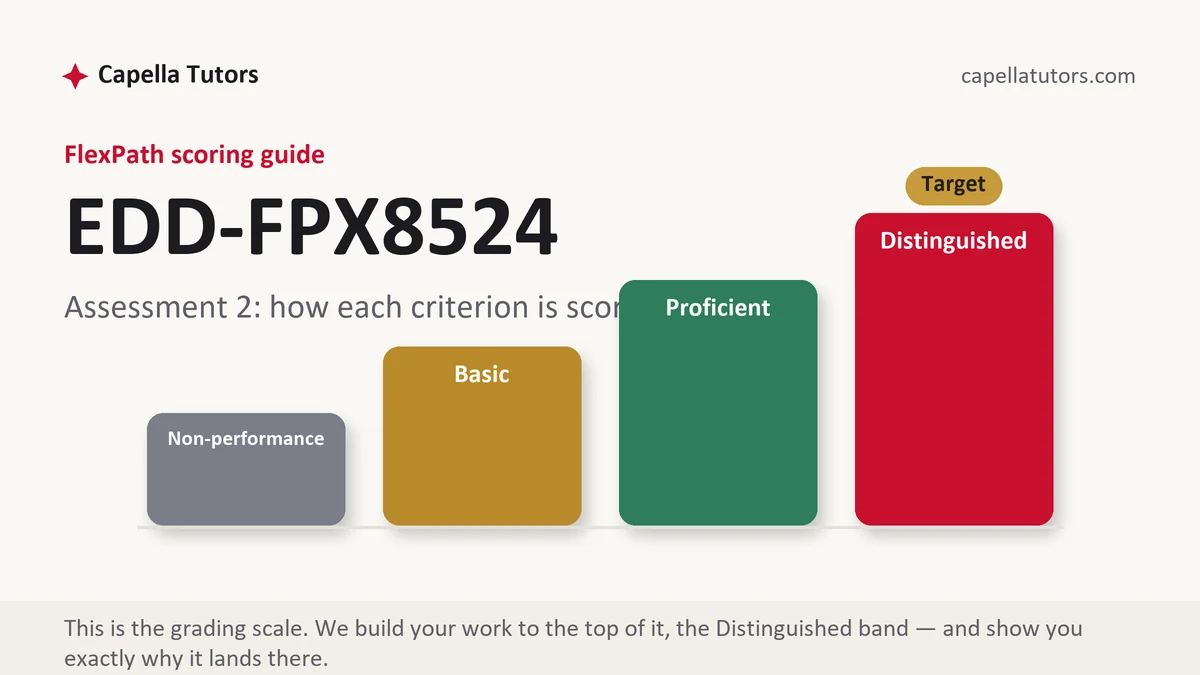
How EDD FPX 8524 Assessment 2 is scored
There is no aggregate grade. Every criterion resolves to one of four levels, and reading the level wording closely is where the work starts:
| Level | What it means on a projection and its consequences |
|---|---|
| Distinguished | Horizon and unit are fixed at the top and held, every figure carries a base year and a rate, at least one alternative case is worked, and the projection becomes a decision with a threshold. |
| Proficient | A sound projection with its assumptions stated. Complete, and short of the row above wherever only one case is run or the number never reaches a building or a payroll. |
| Basic | A trend described and extended, with general concern about falling enrollment. No base year, no rate, nothing a board could act on. |
| Non-performance | A required element is absent, commonly the assumption set, or the consequence the criterion asked you to draw. |
The strongest thing about a demographic projection is that its inputs already exist: children entering kindergarten in five years have been born, and migration is the main source of error. That is why faculty read this deliverable arithmetically, and why an unstated assumption costs more here than anywhere else in the course.
The EDD FPX 8524 Assessment 2 method, step by step
-
Fix the horizon and the unit first
A three-year projection is a budget and staffing question; a ten-year projection is a facilities and governance question, and they are different papers. The unit matters as much, since a claim true of a state is often false for one district and useless for one campus. Write both at the top of the draft and hold them.
-
Choose a leading indicator, not a lagging one
Total enrollment tells you what already happened. Kindergarten registration in April, county births five years back, transfer requests before the October count and preschool waitlists tell you what is arriving. Say which indicator you chose, why it leads, and how many years of it you actually have.
-
Show the arithmetic on the page
Give the base year, the count, the rate and the result, then the subtraction. A reader who cannot reproduce your number will not credit it. Where the rate averages several years, say how many, and where one year is an outlier, say what you did with it rather than smoothing it away quietly.
-
Run a second case
A single line extended forward is a guess with decimal places. Work the case where the rate halves, or where the neighboring district's open-enrollment draw stops, and set both results side by side. The gap between the two cases is usually the real finding, since it shows how much of the future is inside a board's control.
-
Convert the number into a decision
Projections earn nothing until they touch something. Find the threshold: the enrollment at which a grade level cannot be staffed, the point where a building's fixed cost per student crosses a stated line, the year a section disappears. Twenty-eight students lost across six buildings removes no teacher at all, and saying so is what makes the analysis credible.
-
Name your indicator and self-score
Say what you would watch to learn which case you are in, with a date: April registration counts, the October census, open-enrollment applications by a fixed deadline. Then mark each criterion honestly, recompute every figure once, and submit when the arithmetic survives a second reader.
A structure that maps to the criteria
The targets below are our planning numbers for a projection deliverable, not Capella requirements. Give the arithmetic section room, since that is the row faculty check hardest.
| Section | What it must do | Guide |
|---|---|---|
| Horizon, unit and question | The years covered, the district or campus in question, and the decision the projection informs. | ~180 words |
| Evidence base | Each figure with its source agency, its collection year, and the number of prior years available. | ~250 words |
| The projection worked | Base year, rate, result, and the subtraction shown step by step. | ~300 words |
| The alternative case | A second set of assumptions, its result, and what the gap between cases means. | ~250 words |
| Consequence and thresholds | Staffing, facilities and revenue effects, with the threshold at which a decision becomes forced. | ~300 words |
| Monitoring indicators and references | What you watch, when you watch it, and current APA in text and list. | ~150 words |
Annotated sample excerpt
A model paragraph from our team showing the arithmetic a projection criterion rewards. Study the structure, then rebuild it with your own agency figures.
Kindergarten registration on the April count has fallen from 214 to 178 across four years, an average of 4.5 percent a year, and county births five years back are down 6 percent over the same period.1 Holding that rate from a base of 178 gives roughly 142 entering kindergarteners in five years, a loss of 36 children at entry, which under a state allocation near 11,400 dollars per pupil is about 410,000 dollars of recurring revenue at each grade level as the smaller cohorts move up.2 A second case, in which the neighboring district's open-enrollment draw stops after its bond fails and the rate halves, gives about 159; the 17-student gap between the cases is the share of the decline attributable to a neighbor's decision rather than to births.3
- 1Two independent indicators, one of them leading by five years. Births already recorded are the strongest input a school projection has, and citing both makes the rate defensible.
- 2Base year, rate, result and dollar conversion, all reproducible. A reader can check the arithmetic without asking the writer for a spreadsheet.
- 3A second case with a named cause, worked to a number. The gap between cases separates what the district controls from what it only absorbs.
The full premium sample for your exact assessment, written fresh to your scoring guide and issue, is free to request. Study it, revise it into your own voice, and submit work you understand.
The five mistakes that cost Distinguished
- A rate with no base year. A percentage decline reported without the count it started from cannot be extended by anybody except its author.
- Lagging indicators only. Total enrollment describes what already happened, while registration counts and prior births describe what is arriving.
- One case run forward. A single projection tests nothing, since the useful information is the distance between two plausible futures.
- A revenue figure with no payroll beside it. Money falls in per-pupil increments while staffing falls in whole positions, and that mismatch is the actual problem.
- No threshold. A projection that never names the enrollment at which a decision becomes forced leaves a board with a number and no question.
Pre-submission checklist
- Horizon and unit stated in the opening and held through every later claim
- Every figure cited to the agency that published it, with its collection year
- Base year, rate and result shown so a reader can reproduce the number
- A second case worked, with the cause of the difference named
- One threshold identified at which a staffing or facilities decision becomes forced
- A monitoring indicator with a date, and every figure recomputed before submission
Projection or facilities analysis due?
Send the prompt, the guide, your district's size and state, and whatever counts you can share. Eight people take it from the agency data pull to the final proofread and return a premium original sample in 24 to 48 hours with the arithmetic shown and a second case worked, revised free until the guide is met.