This manual is for CSC FPX 4040 Assessment 2, start to submission. Assessment 2 in CSC FPX 4040, Computer Vision, is usually where the method has to be measured instead of demonstrated: ground truth labelled in advance, results reported as counts, the overlap threshold stated, and the numbers broken out by the conditions that actually change the answer. Each criterion is marked separately against the guide in your courseroom. What follows is the working order we use, a layout the criteria dictate, and an annotated excerpt. Would you rather hand it across? One message brings an original premium sample within 24 to 48 hours, reworked free of charge until the guide has nothing left to say. Capella's catalog lists the course as CSC-FPX4040, and some courserooms print CSC4040; both point to this same Assessment 2.
One honesty note before the manual: Capella revises courses and scoring guides over time, so always write to the exact scoring guide attached to your assessment in the courseroom. The course identity above is verified on capella.edu; the method and structure below are our tutors' approach to it, not Capella's official rubric text.
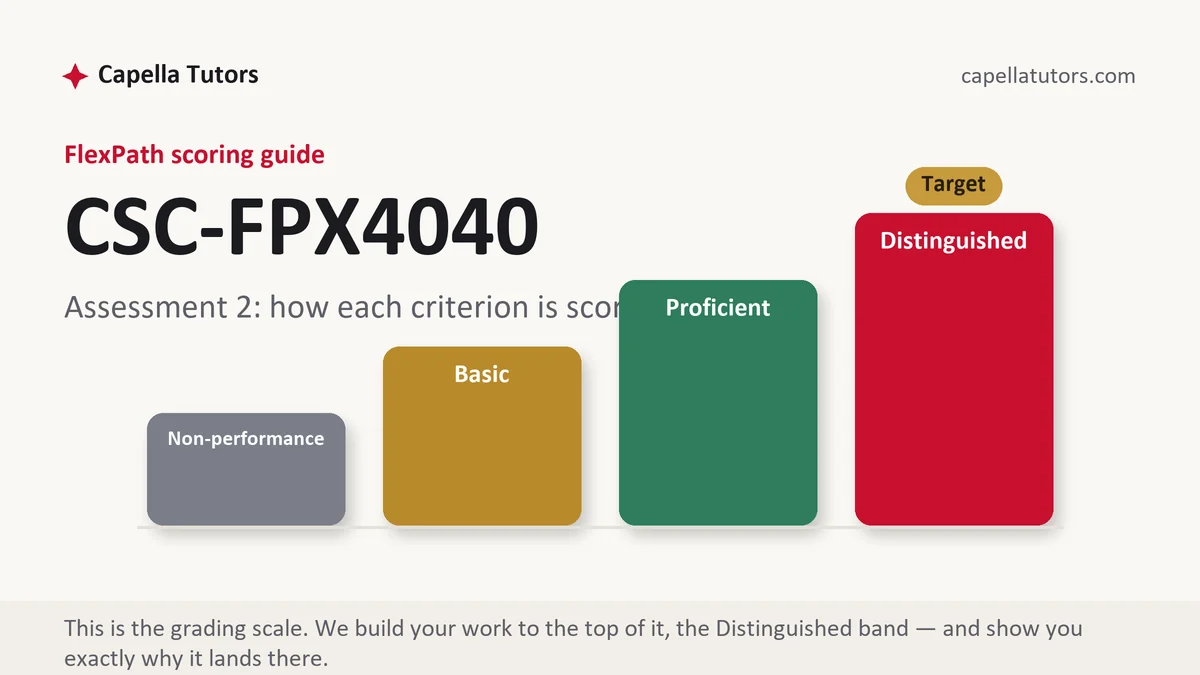
How CSC FPX 4040 Assessment 2 is scored
Levels replace marks in FlexPath, one level for every criterion in the guide, and the wording tells you what to produce:
| Level | What it means on a detection evaluation |
|---|---|
| Distinguished | The labelled set was built before any tuning, the overlap threshold is stated in the text, results are given as counts and broken out by condition, and the worst condition is the one discussed at length. The evaluation set is described precisely enough to rebuild. |
| Proficient | Ground truth, a stated metric, and correct overall figures. Complete, with one average standing in for several very different situations. |
| Basic | A single strong frame offered as the result, or one overall percentage with no threshold attached. A demonstration where the criterion asked for a measurement. |
| Non-performance | A required element never appears, most often the ground truth itself or the threshold the figures were scored at. |
Build the evaluation set before you tune anything. A pipeline adjusted against the same pictures used to judge it has been fitted to them, and no number produced afterwards means what it appears to mean.
The CSC FPX 4040 Assessment 2 method, step by step
-
Headings from the criteria, then design the test set by condition
Decide which conditions the system will actually meet, which in practice means light level, range, viewing angle, targets partly hidden, and busy backgrounds, then gather a few frames of each and label every one. Coverage beats volume here, and thirty deliberately varied frames support a results table that three hundred taken at one desk cannot.
-
Label the ground truth before the method is touched
Write down what counts as a correct answer while you still have no stake in the outcome. Labelling after tuning turns the ground truth into a description of what the pipeline already does, and an evaluator reading closely can usually see it.
-
State the overlap threshold in the prose
A predicted box scores against a true one by the ratio of their shared area to their combined area, and identical predictions produce very different figures at a half overlap and at three quarters. Give a detection figure without its threshold and nothing can be set beside it, not even your own earlier run.
-
Report counts, not just rates
State the number of objects actually there, the number correctly located, the number conjured up, and the number overlooked. A rate compresses four numbers into one and throws away the part a reader needs in order to judge whether the system is usable.
-
Break the results out by condition
One average across every frame hides the only finding worth writing down. A detector at ninety percent overall may be near perfect in flat light and barely working against a low sun, and the table that separates them is the artefact the evaluation criterion is looking for.
-
Put the failures in the document, then self-score
Print two or three of the frames the method failed on, each with one sentence identifying what defeated it. Then read every criterion, assign yourself a level, and rewrite anything under the top one before submitting.
A structure that maps to the criteria
These figures are our tutors' planning targets for an evaluation of this shape, not Capella rules; expand whichever section your criteria weight most.
| Section | What it must do | Guide |
|---|---|---|
| Evaluation set | How the frames were gathered, which conditions they cover, which they miss, and how many of each. | ~250 words |
| Ground truth and metric | What counts as correct, who labelled it and when, the metric, and the threshold it is scored at. | ~250 words |
| Worked overlap example | One predicted region against one true region, with the shared and combined areas given as numbers. | ~200 words |
| Results by condition | Counts of present, found, invented, and missed, one row per condition. | ~300 words |
| Failures | The frames that broke, a cause for each, and what fixing them would take. | ~250 words |
| References | Toolkit documentation with versions, the papers behind the operators, image licence, current APA. | as needed |
Annotated sample excerpt
Another original excerpt from our team, offered as a model of how an overlap figure is made checkable. Read the moves, then score your own detections the same way.
One bay makes the arithmetic concrete: the labelled region is 120 by 60 pixels, the predicted region is 132 by 54, they share a rectangle of 108 by 48, and so they overlap on 5,184 pixels out of a combined 9,144, a ratio of 0.57.1 That single box counts as a hit at the half threshold used throughout this report and would count as a miss and a false alarm together at three quarters, which is why the threshold is stated here rather than left to the reader.2 Across 180 labelled frames covering 24 bays the detector found 2,290 of the 2,510 occupied bays and invented 210, and the average hides the finding: overcast frames scored 96 percent, frames under direct low sun with bay lines in shadow scored 61 percent, and every one of the worst cases has a shadow edge running diagonally through the bay.3
- 1Works the overlap on real pixel counts so a reader can check the ratio without trusting it. One worked example answers the metric criterion.
- 2States the threshold and says what would change at a stricter one. A figure quoted with its threshold is comparable; one without it is not.
- 3Gives counts rather than a rate, splits the result by condition, and names what the worst cases have in common. That last clause is the diagnosis a failure criterion wants.
The full premium sample for your exact assessment, written fresh to your scoring guide and issue, is free to request. Study it, revise it into your own voice, and submit work you understand.
The five mistakes that cost Distinguished
- One screenshot offered as the result. A frame where everything worked is a demonstration, and the criterion asked to see a measurement.
- An overlap threshold left unstated. A detection percentage is unreadable until the reader knows how generous the scoring was.
- Test frames that were also tuning frames. A figure produced on the very images you adjusted the settings against is a reflection of that adjustment.
- One overall average. A single figure across every condition buries the only result worth reporting.
- Rates with no counts behind them. Ninety percent of an unstated number of objects is not a finding.
Pre-submission checklist
- An evaluation set built by condition, with the conditions it misses named
- Ground truth labelled before any tuning, with who labelled it and when
- The overlap threshold stated in the prose, not implied by a library default
- One overlap worked in pixel counts a reader can check
- Counts of present, found, invented, and missed, broken out by condition
- Three failures with causes named, references reconciled both ways in current APA
Detector working and the results table thin?
Send the frames, the labels if you have them, and the criteria. Back comes the evaluation set by condition, the worked overlap arithmetic, the counts rather than the rates, and the failure cases diagnosed, inside 24 to 48 hours with free revisions until your guide is satisfied. First one free, no conditions.