This manual is for BUS FPX 4070 Assessment 3, start to submission. A closing assessment in this course often gives you statements rather than a project, which changes the deliverable to position analysis without changing the standard. The assessment usually wants every figure compared against a benchmark and organised around findings rather than around categories, ending in something a lender or an owner could act on. You can also hand it off, and a premium original sample grouping the ratios into findings returns inside 24 to 48 hours, revised at no cost until every criterion is met. Capella's catalog lists the course as BUS-FPX4070, and some courserooms print BUS4070; both point to this same Assessment 3.
One honesty note before the manual: Capella revises courses and scoring guides over time, so always write to the exact scoring guide attached to your assessment in the courseroom. The course identity above is verified on capella.edu; the method and structure below are our tutors' approach to it, not Capella's official rubric text.
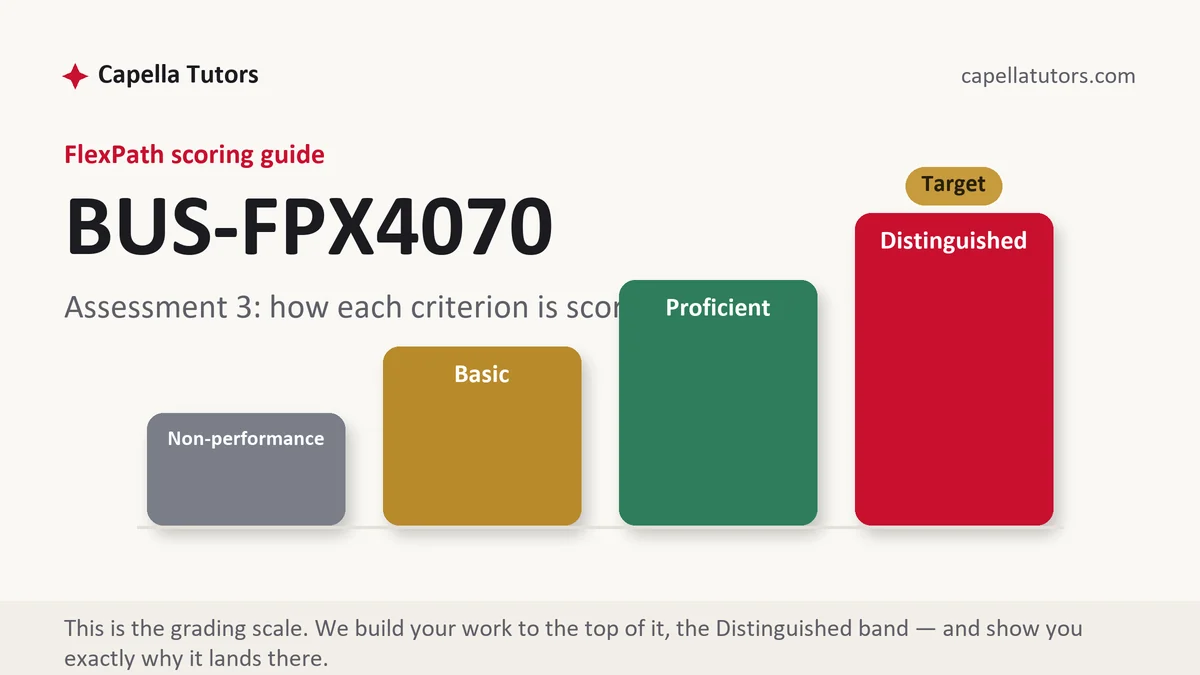
How BUS FPX 4070 Assessment 3 is scored
Every criterion is graded independently at one of four levels, and that wording is the brief:
| Level | What it means on a financial position analysis |
|---|---|
| Distinguished | Comparison against a stated benchmark or the firm's own history, the trend interpreted, and the ratio findings connected to the cash the business actually generates. |
| Proficient | The ratios computed correctly and compared against a benchmark. |
| Basic | A table of ratios with a sentence under each and no finding. The commonest middle-column outcome. |
| Non-performance | A required element absent, usually the benchmark or the conclusion. |
Ratios are computed from accounting figures that reflect policy choices, so two firms with identical operations can report different inventory turns because of the cost flow assumption they use. Name the comparison and its origin, and lean on movement inside one firm rather than across firms whenever the accounting choices cannot be seen.
The BUS FPX 4070 Assessment 3 method, step by step
-
Build headings from the criteria and choose the benchmark first
A ratio with nothing to compare it to answers nothing, so decide before computing whether the comparison is the firm's own history, a named peer set or an industry database. Then state that choice in the paper and explain why it fits.
-
Compute across all four families
Liquidity, leverage, activity and profitability, each with the formula you used, because variants exist and a reader cannot check a figure without knowing which one produced it. Keep the same definition across years.
-
Organise the discussion around findings, not categories
A firm whose inventory has slowed while its payables have stretched is telling one story about cash, and presenting it that way is far more useful than a table with twelve ratios and a line under each. Group the ratios that belong to the same finding.
-
Build the cash conversion cycle and read it
Days inventory plus days receivable minus days payable turns three activity ratios into one number with a unit anybody understands. It also exposes the case where a liquidity ratio improved for a reason nobody should be pleased about.
-
Use common size statements to show shape
Expressing every line as a percentage of revenue or of total assets shows how the cost structure and the balance sheet are changing in a way absolute figures hide, and it makes a comparison across years or firms of different sizes legitimate.
-
Connect it to cash, then self-score
The question a lender or an owner actually has is whether the business generates enough cash to service what it owes, so tie the findings to the cash flow statement rather than leaving them on the ratio page. Then grade each row yourself and submit early.
A structure that maps to the criteria
These are our tutors' planning targets for a position analysis, not Capella rules; wherever your guide asks for a different balance, follow it.
| Section | What it must do | Guide |
|---|---|---|
| The firm and the benchmark | What the business does, what period is covered, and what the comparison is and why. | ~180 words |
| The ratios | All four families with the formula used for each and the same definition across years. | ~270 words |
| Findings | The ratios grouped into two or three stories, each stated as a finding rather than a number. | ~290 words |
| The cash conversion cycle | Days inventory, days receivable and days payable combined, with the direction of travel. | ~250 words |
| Common size | Revenue and asset structure as percentages, with what the shape change reveals. | ~220 words |
| Cash and references | Whether the business generates enough cash to service what it owes, plus current APA. | as needed |
Annotated sample excerpt
An original excerpt from our team showing a ratio that improved for the wrong reason. Read it for the reasoning, then rebuild it around the statements your criteria supply.
The current ratio rose from 1.9 to 2.3 over three years, which reads as improving liquidity until the components are opened: the increase is almost entirely inventory, since days inventory went from 107 to 140 while receivable days moved only from 41 to 44.1 Payables tell the other half, having stretched from 38 days to 61, so the cash conversion cycle went from 110 days to 123 even though the firm is holding a third more inventory than before, which means part of the cash the slowdown consumed has been financed by paying suppliers later rather than by trading better.2 Read against the cash flow statement the picture is consistent, because operating cash flow has fallen while the reported current ratio improved, and the finding a lender needs in one sentence is that this dealer is carrying more machines for longer and funding them on supplier terms, which is sustainable only for as long as those suppliers agree.3
- 1Reports the headline ratio, then immediately opens its components and identifies which one moved. A ratio explained by its parts is a finding; the ratio alone is a number.
- 2Combines three activity measures into the cash conversion cycle and names what is financing the deterioration. This is the sentence that makes the analysis useful.
- 3Connects the ratio story to the cash flow statement and states the finding in the terms a lender would use, with the condition it depends on. Landing on cash is the top-column move.
The full premium sample for your exact assessment, written fresh to your scoring guide and issue, is free to request. Study it, revise it into your own voice, and submit work you understand.
The five mistakes that cost Distinguished
- Ratios computed against no benchmark at all. A liquidity figure means nothing on its own until a peer set or the firm's own earlier years sits beside it.
- A table with a sentence under each line. Twelve ratios described in turn is not analysis, and the findings row will find nothing to grade.
- A liquidity improvement accepted at face value. A ratio can improve because inventory is not moving, and the components have to be opened before the trend is interpreted.
- Formulas left unstated. Variants exist for most ratios, and a figure whose definition is hidden cannot be checked or compared.
- The cash flow statement ignored. The question a lender has is about cash, and an analysis that stays on the ratio page has not answered it.
Pre-submission checklist
- The benchmark is chosen and justified before any ratio is computed
- All four families are covered with the formula stated for each
- The discussion is organised around findings rather than categories
- The cash conversion cycle is built and its direction interpreted
- Common size statements show the change in shape
- The findings are connected to the cash flow statement, APA matched both ways
Position analysis due and the ratios will not add up to a story?
Send the statements and the criteria. We compute against a stated benchmark, group the ratios into findings, build the cash conversion cycle and land the analysis on whether the business generates enough cash to service what it owes. It comes back inside 24 to 48 hours and is reworked at no charge until each row clears.