This manual is for BUS-FPX4064 Assessment 2, start to submission. Assessment 2 in BUS-FPX4064, Cost Accounting for Planning and Control, usually asks you to evaluate a costing or control system rather than simply operate one, which means costing the same product two ways, showing where the two answers diverge, naming the feature of the product that caused the divergence, and then deciding whether a better system is worth what it costs to run. Below is how our tutors build that comparison, a structure the criteria map onto cleanly, and an annotated sample excerpt. Prefer to have it built? Send the cost pools and the driver data and a premium original sample comes back in 24 to 48 hours, revised free until the criteria are met. Your courseroom may print this as BUS FPX 4064 Assessment 2 or BUS4064 Assessment 2; it is the same deliverable, and BUS-FPX4064 Assessment 2 is what this manual walks through.
One honesty note before the manual: Capella revises courses and scoring guides over time, so always write to the exact scoring guide attached to your assessment in the courseroom. The course identity above is verified on capella.edu; the method and structure below are our tutors' approach to it, not Capella's official rubric text.
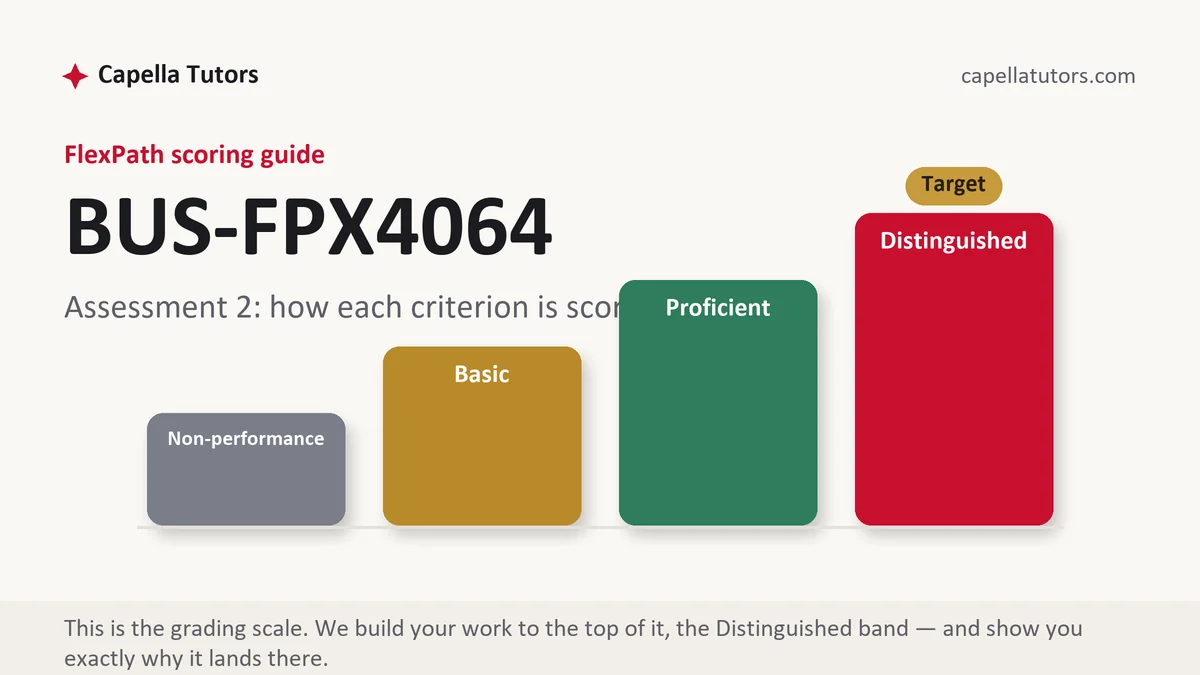
How BUS-FPX4064 Assessment 2 is scored
No letter grade comes back from FlexPath. Each criterion lands at one of four levels, and the level language tells you what the section has to do:
| Level | What it means on a system evaluation |
|---|---|
| Distinguished | The same product is costed under both systems with the arithmetic shown, the difference is quantified and explained by a named characteristic of that product, and the recommendation weighs the improvement against the cost of running the better system. |
| Proficient | Both methods applied correctly and the difference reported. Accurate, and one step short of explaining what produced it. |
| Basic | A description of how the two approaches differ in principle, with no product costed under either. The most common first submission in this assessment. |
| Non-performance | Only one method applied, or no recommendation reached. A comparison with nothing to compare floors the criterion. |
The reason this deliverable exists is that a single overhead rate assumes one thing drives every support cost, and in most operations that assumption is quietly false. Costs caused per order do not scale with hours. Costs caused per setup do not scale with volume. Whenever a business sells both large jobs and small ones, a volume-based rate charges the large jobs for capacity the small ones consumed, and the products that look least profitable on paper are frequently the ones subsidising everything else.
The BUS-FPX4064 Assessment 2 method, step by step
-
Turn the criteria into headings, then read the case for the giveaway data
Order counts, setup numbers, inspection hours and delivery stops sitting beside the conventional cost data are an invitation. The case supplied them because a single rate cannot use them, and noticing that in your first paragraph puts you ahead of most submissions.
-
Compute the traditional rate and use it
Total the overhead, divide by the volume base the business currently uses, and cost at least two products with it. Do this properly rather than dismissively, because the criteria want the comparison and the traditional figure is half of it. It is also the number the business is pricing from today.
-
Group the costs by what actually causes them
Build a small number of pools with an honest driver each, and resist the temptation to build twelve. Three or four pools with defensible drivers will produce a better answer than a dozen with guessed ones, and every pool you add is something the business has to measure every month afterwards.
-
Cost the same products again and quantify the gap
Apply the activity rates to the same two products, then state the difference in dollars and as a percentage of the original figure. A percentage is what makes the finding land, because an owner reads a 53 percent understatement differently from a 52 dollar one even when they are the same fact.
-
Name the characteristic that caused the distortion
This is the sentence the top level is paying for. Small jobs are usually undercosted because order handling, setup and administration are incurred per job and a volume base spreads them by size instead. Long jobs are usually overcosted for the same reason in reverse. Say which characteristic of your product did it.
-
Recommend proportionately, then self-score
A better system has a running cost: drivers have to be counted, staff have to record them, and somebody has to maintain the model. Say whether the improvement justifies that, and be willing to conclude that it does not for a small single-line operation. Then mark each criterion D, P, B or N yourself, revise anything under D, and submit early in the week.
A structure that maps to the criteria
These targets are how our tutors plan a system evaluation of this size, not Capella rules; grow whichever section your own guide weights most.
| Section | What it must do | Guide word target |
|---|---|---|
| The current system | The existing base, the total overhead, the rate that results, and what the business does with it. | ~200 words |
| Costing under the current rate | At least two products costed the existing way, with the multiplication shown. | ~200 words |
| Activity pools and drivers | Each pool, the cost in it, the driver chosen, the driver volume, and the rate that falls out. | ~300 words |
| Costing under the activity rates | The same products recosted, with each pool's charge listed and totalled. | ~250 words |
| The difference explained | The gap in dollars and percentage terms, plus the product characteristic that produced it. | ~250 words |
| Recommendation, running cost and references | Whether the change is worth its running cost, what to do about pricing, and APA both ways. | ~250 words |
Annotated sample excerpt
An original model excerpt from our team, showing what the comparison reads like once both answers are on the page. Take the moves and rebuild them from your own pools.
Alder & Pike Photography carries 197,100 dollars of studio overhead and currently spreads it across 6,000 billable hours, giving a single rate of 32.85 dollars an hour, so the thirty-minute portrait mini-session that consumes one shoot hour, two editing hours and one print order is charged 3 hours at 32.85, or 98.55 dollars.1 Rebuilt into pools, the studio and equipment cost of 77,500 dollars over 2,500 shoot hours gives 31.00 an hour, the retouching workstation cost of 70,000 dollars over 3,500 editing hours gives 20.00 an hour, and order fulfilment of 49,600 dollars over 620 orders gives 80.00 an order, so the same mini-session costs 31.00 plus 40.00 plus 80.00, or 151.00 dollars.2 The single rate understates that package by 52.45 dollars, or 53 percent, and the cause is visible in the third pool: an order costs 80 dollars to fulfil whether it follows a twenty-minute sitting or a twelve-hour wedding, and an hourly base charges the wedding for it instead.3
- 1The existing rate derived and applied to a named product in one sentence. Costing something with the traditional method is not a formality, it is the baseline the criterion compares against.
- 2Three pools, three drivers, three rates and the recosting, with every division and addition visible. Listing the pool charges separately lets a reader see which pool moved the answer.
- 3The gap in dollars and percent, then the characteristic that caused it. Naming the per-order cost as the mechanism is the analytical move that separates the top two levels here.
The full premium sample for your exact assessment, written fresh to your scoring guide and issue, is free to request. Study it, revise it into your own voice, and submit work you understand.
The five mistakes that cost Distinguished
- The two systems described but never applied. A criterion asking you to evaluate a costing system wants two numbers for the same product, and prose about principles supplies neither.
- Drivers chosen because the data exists. A driver has to cause the cost in the pool, and picking one for convenience produces a model that is precise about the wrong thing.
- The difference stated without a cause. Reporting that one method gives a higher figure is arithmetic, and the criterion is asking which feature of the product produced the gap.
- Pool proliferation. A dozen pools with estimated drivers is less defensible than four with real ones, and nobody in the business will keep the model current.
- A recommendation with no running cost attached. Measuring drivers takes staff time every month, and an operation with one product line will never recover that outlay.
Pre-submission checklist
- The existing rate derived from the stated base and total overhead
- At least two products costed under both systems, arithmetic visible
- Each activity pool paired with a driver that plausibly causes its cost
- The difference expressed in dollars and as a percentage
- The product characteristic that caused the distortion named explicitly
- The recommendation weighed against the cost of maintaining the new system
Costing system evaluation due?
Send the overhead pools, whatever driver data the case supplies and the criteria. We cost the products both ways, quantify the gap in dollars and percent, name what caused it and size the recommendation against what the new system costs to run. No charge on the first premium sample.