This manual is for BUS FPX 4045 Assessment 3, start to submission. The Pre-Employment Screening Process asks you to design how an organization screens applicants: how to narrow the candidate pool, how to run the first interview, which background checks to use, and the possible legal issues in screening, such as discrimination, privacy and the Fair Credit Reporting Act. The grade turns on a fair, lawful process. A process with clear criteria applied consistently, and legal pitfalls addressed, scores above a list of screening tools. Below is the method our tutors use, a structure that maps to the criteria, and an annotated sample excerpt. Prefer to hand it off? A premium original sample for this exact assessment comes back in 24 to 48 hours, revised free until it meets the guide. Capella's catalog lists the course as BUS-FPX4045, and some courserooms print BUS4045; both point to this same Assessment 3. In current courserooms this assessment typically appears as "Pre-Employment Screening Process".
One honesty note before the manual: Capella revises courses and scoring guides over time, so always write to the exact scoring guide attached to your assessment in the courseroom. The course identity above is verified on capella.edu; the method and structure below are our tutors' approach to it, not Capella's official rubric text.
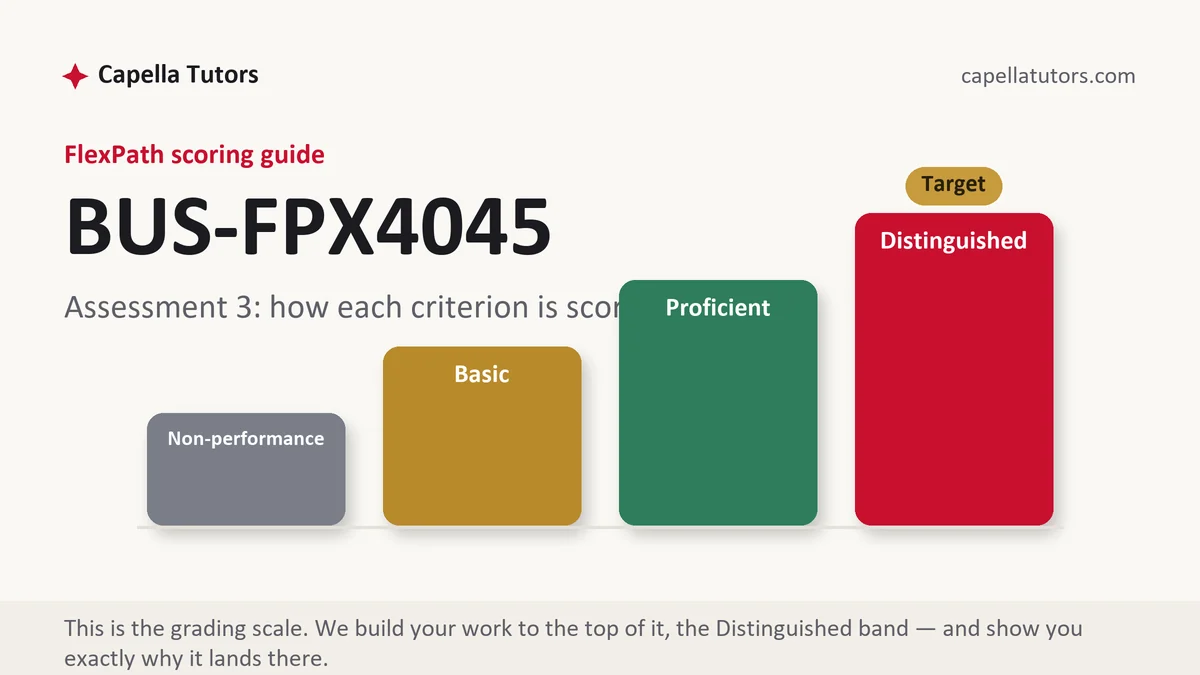
How BUS FPX 4045 Assessment 3 is scored
FlexPath does not use letter grades. Each criterion in the scoring guide lands on one of four levels, and the level descriptions are the real writing brief:
| Level | What it means on a screening process plan |
|---|---|
| Distinguished | The screening process plan is specific to the organization or case, applies course concepts accurately with credible sources, and ends in justified conclusions or recommendations. |
| Proficient | The screening process plan is accurate, but the application or recommendations are general. |
| Basic | The screening process plan describes concepts with little application. |
| Non-performance | A required part of the screening process plan is missing. |
Use a specific job so the screening steps fit it.
The BUS FPX 4045 Assessment 3 method, step by step
-
Set criteria
Must-have qualifications from the job analysis.
-
Narrow the pool
Resume review and short phone screens against the criteria.
-
Run the first interview
Structured questions asked of every candidate.
-
Choose background checks
Employment verification, criminal history where relevant, references.
-
Address legal issues
EEOC guidance on criminal records, FCRA consent, consistent treatment.
-
Document decisions
Records that show criteria were applied fairly.
A structure that maps to the criteria
Word counts are planning targets our tutors use, not Capella rules; follow the length and format your scoring guide states.
| Section | What it must do | Guide |
|---|---|---|
| Introduction | The job and purpose. | ~50 words |
| Narrowing the candidate pool | Criteria and steps. | ~100 words |
| First interview | Structured approach. | ~100 words |
| Background checks and legal issues | Checks and law. | ~150 words |
| References | Sources. | as needed |
Annotated sample excerpt
An original model excerpt from our team, written to show the register that reaches the top of the guide. Learn the moves, then write your own version.
Criminal background checks carry the most legal risk, because blanket exclusions can have a disparate impact on some racial groups, and EEOC guidance asks employers to consider the nature of the offense, the time passed and its relevance to the job.1 Many states and cities also have fair-chance laws that delay criminal history questions until after a conditional offer.2 The process therefore runs the check only after an offer, applies an individualized assessment, and gives the candidate a chance to explain before any final decision.3
- 1Explains the risk and the EEOC factors.
- 2Notes state and local fair-chance laws.
- 3Turns the law into process steps.
The full premium sample for your exact assessment, written fresh to your scoring guide and topic, is free to request. Study it, revise it into your own voice, and submit work you understand.
The five mistakes that cost Distinguished
- Definitions without application. Apply each concept to the organization or case.
- No sources. Cite credible business sources.
- Vague recommendations. Make them specific and justified.
- Tools without process. Design consistent steps.
Pre-submission checklist
- Criteria set
- Pool narrowed consistently
- Structured first interview
- Background checks chosen
- Legal issues addressed
- References
Want the screening process plan written?
Send the scoring guide and any materials from your courseroom. Our team returns a premium original screening process plan in 24 to 48 hours, revised free until it meets the guide.