How to write BUS-FPX4043 Assessment 3

The short answer

This manual is for BUS-FPX4043 Assessment 3, start to submission. Assessment 3 is where the structure meets real people: employees placed in grades, compa-ratios calculated, compression found, a correction costed, and benefits valued rather than listed. The assessment usually asks you to apply your pay structure to an actual population and recommend what the employer should do about the outliers, and your scoring guide decides whether a total rewards communication comes with it. Below is the order our tutors work in, a structure that tracks the criteria, and an annotated sample excerpt. Prefer to hand it off? A premium original sample for this exact assessment comes back in 24 to 48 hours, revised free until it meets the guide. Your courseroom may print this as BUS FPX 4043 Assessment 3 or BUS4043 Assessment 3; it is the same deliverable, and BUS-FPX4043 Assessment 3 is what this manual walks through.

One honesty note before the manual: Capella revises courses and scoring guides over time, so always write to the exact scoring guide attached to your assessment in the courseroom. The course identity above is verified on capella.edu; the method and structure below are our tutors' approach to it, not Capella's official rubric text.
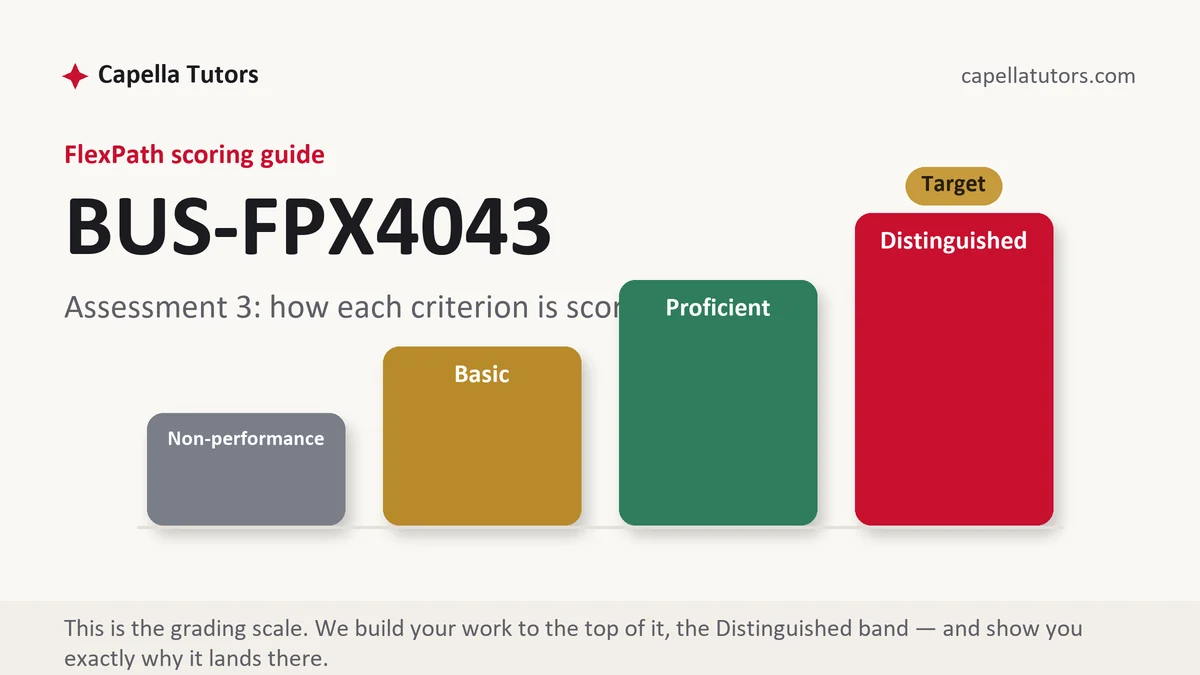
BUS-FPX4043 Assessment 3 grading scale at Capella FlexPath, the criterion levels this assessment is scored on, from Capella Tutors
How Capella FlexPath grades BUS-FPX4043 Assessment 3, visualized by Capella Tutors.

How BUS-FPX4043 Assessment 3 is scored

Marks arrive criterion by criterion rather than as one grade, and each criterion sits at one of these four levels:

LevelWhat it means on a placement and cost analysis
DistinguishedCompa-ratios are computed for the real population, compression is demonstrated by comparison rather than asserted, the correction is costed with payroll-linked costs included, and the fix is sequenced over a stated period.
ProficientEmployees placed correctly and the outliers identified, with a remedy proposed. Complete, and usually missing the payroll cost of the remedy.
BasicA statement that employees are paid appropriately, with the ratio described in words and never calculated for anybody.
Non-performanceA required element is missing outright, most often the cost of the recommendation, or any treatment of benefits where the guide asks for total compensation.

Compa-ratio, an employee's pay divided by the grade midpoint, is the most useful single diagnostic in compensation, and it only works as a number. A department where everyone sits above 1.10 has a different problem from one where the newest hires sit near the midpoint and the ten-year veterans sit below it.

The BUS-FPX4043 Assessment 3 method, step by step

  1. Slot every employee before analyzing anybody

    Place each person in the grade their job evaluated into, not the grade their pay suggests. Then flag anyone below the minimum or above the maximum, since those two groups need different answers and mixing them produces a recommendation that fits neither.

  2. Calculate the ratios and put them in a table

    Pay divided by midpoint, one row per employee or per role group, carried to two decimals. The distribution is the finding: a cluster low in the range says the employer is either hiring cheap or losing people, and a cluster high says the grade is capped and progression has nowhere left to go.

  3. Demonstrate compression instead of naming it

    Compression shows up when you put a long-tenured employee's ratio next to a recent hire's in the same grade. Show both numbers and let the comparison do the work. Then say what caused it, since hiring at market while holding internal increases below market is the usual mechanism and it will keep operating until something changes.

  4. Cost the correction, including what rides on payroll

    Add up what it takes to bring everyone below the minimum up to it, then add the employer payroll taxes and any benefit tied to salary, because the true cost of a raise exceeds the raise. Show the multiplication. A recommendation without this number cannot be approved by anybody with a budget.

  5. Sequence the fix and say what happens to the rest

    Few employers can correct a whole structure in one payroll cycle. Stage it: below-minimum first, compression next, and everything else at the annual review, with the cost of each stage stated. Then say what the ongoing wage bill looks like once the structure is in place, since a one-time figure understates a permanent change.

  6. Value the benefits, then self-score

    Where the guide asks for total compensation, put a figure on the employer share of health coverage, the retirement contribution, paid time off valued at the employee's own rate and the statutory costs, then show base and total side by side. Benefits are stickier than pay, so treat any reduction carefully. Then self-score every criterion honestly and file early in the week.

A structure that maps to the criteria

Word targets here are our tutors' planning figures for a placement deliverable, not Capella rules; if your guide asks for a total rewards statement, take the words from the background section.

SectionWhat it must doGuide
Population and structureThe employees in scope, the grades they slot into, and the structure being applied to them.~200 words
Placement and ratiosEvery employee or role group placed, compa-ratios calculated, and the distribution described.~300 words
Outliers and compressionWho sits outside the range, where compression appears, and the mechanism that produced it.~300 words
Cost of correctionWhat the fix costs in year one, what rides on payroll with it, and the ongoing effect on the wage bill.~300 words
Sequencing and communicationThe order of correction, the period it runs over, and what employees are told and when.~200 words
Benefits, compliance and referencesBenefits valued rather than listed, equal pay and classification exposure noted, APA both ways.~250 words

Annotated sample excerpt

An original model from our team on an invented employer, showing compression demonstrated in figures and the correction priced in the same passage.

Sample excerpt: compa-ratio analysis, extract Original model · Capella Tutors

Against a dispatcher midpoint of 54,000 dollars, the longest-serving dispatcher at Quillan Freight sits at 49,700 dollars for a compa-ratio of 0.92, while a dispatcher hired four months ago sits at 55,600 for a ratio of 1.03.1 That inversion is compression, and it has a mechanism rather than a mystery behind it: Quillan has been hiring at the going market rate while holding internal increases at two percent, so every new hire arrives above the people training them.2 Bringing the six dispatchers now below the grade minimum up to it costs about 18,600 dollars in base pay, and once employer payroll taxes and the salary-linked retirement match are added at roughly 21 percent, the first-year figure is closer to 22,500, which is the number the operations director has to approve.3

  • 1Two ratios placed side by side. The criterion asks for the measure to be computed, and the comparison between a veteran and a new hire is what makes the number mean something.
  • 2The cause is named, which turns a finding into something the employer can act on. A compression paragraph that stops at the observation leaves the recommendation with nowhere to go.
  • 3The correction is costed and then loaded with what rides on payroll, arithmetic visible. The last clause names who approves it, which is what makes it a recommendation rather than an observation.

The full premium sample for your exact assessment, written fresh to your scoring guide and scenario, is free to request. Study it, revise it into your own voice, and submit work you understand.

Get the full sample free

The five mistakes that cost Distinguished

  • Compa-ratios described rather than calculated. The entire value of the measure is the number, and a sentence about employees being paid appropriately is not one.
  • Employees slotted by their salary. Placing people in the grade their pay suggests reproduces the problem the structure was built to fix, and hides every outlier.
  • Compression asserted with no pair of figures. It is proved by putting two ratios in the same grade next to each other, and without them the claim is an impression.
  • A remedy with no payroll cost. Employer taxes and salary-linked benefits mean a raise costs more than the raise, and a proposal missing that cannot be approved.
  • Benefits listed instead of valued. Health coverage, retirement, paid time off and statutory costs all have dollar figures, and the total rewards criterion is asking for them.

Pre-submission checklist

  • Every employee placed by evaluated job rather than by current pay
  • Compa-ratios calculated to two decimals and presented in a table
  • Compression demonstrated with two ratios in the same grade and its cause named
  • First-year correction costed, with payroll taxes and salary-linked benefits added
  • The fix sequenced over a stated period, with the ongoing wage bill effect given
  • Benefits valued in dollars, classification and equal pay exposure noted, APA both ways

Placement analysis due and the numbers will not tie out?

Send the population data, your structure and the criteria. We slot every employee by evaluated job, compute the ratios, demonstrate the compression in figures, price the correction with payroll load included, and reconcile every number in the file before it comes back. First premium sample free.

Keep going

Online now