This manual is for BUS FPX 4014 Assessment 3, start to submission. Supply Chain Decisions asks you to interview a supply chain manager, or use the interview materials your courseroom provides, and analyze what you learn: the importance of supply chain management, the operations tools used, alliances and partnerships, component and material acquisition, integration of component parts, and the key tradeoffs of just-in-time manufacturing. The grade turns on connecting the interview to supply chain concepts. Reporting answers scores lower than analyzing them, especially the just-in-time tradeoffs. Below is the method our tutors use, a structure that maps to the criteria, and an annotated sample excerpt. Prefer to hand it off? A premium original sample for this exact assessment comes back in 24 to 48 hours, revised free until it meets the guide. Capella's catalog lists the course as BUS-FPX4014, and some courserooms print BUS4014; both point to this same Assessment 3. In current courserooms this assessment typically appears as "Supply Chain Decisions".
One honesty note before the manual: Capella revises courses and scoring guides over time, so always write to the exact scoring guide attached to your assessment in the courseroom. The course identity above is verified on capella.edu; the method and structure below are our tutors' approach to it, not Capella's official rubric text.
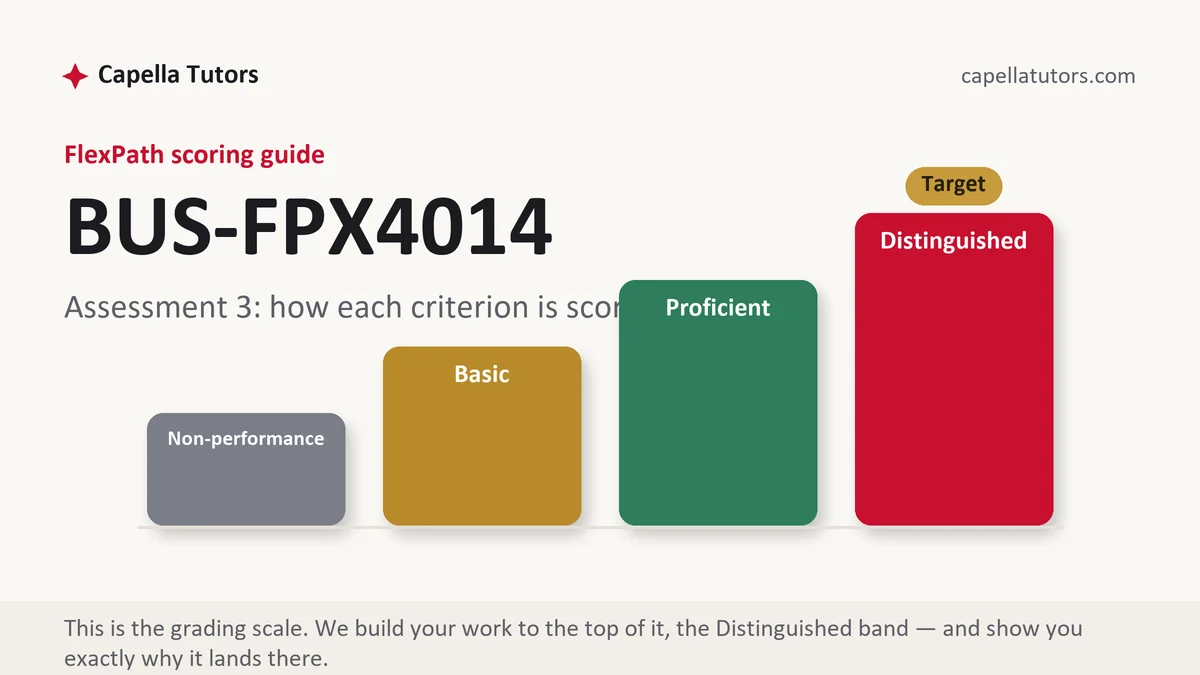
How BUS FPX 4014 Assessment 3 is scored
FlexPath does not use letter grades. Each criterion in the scoring guide lands on one of four levels, and the level descriptions are the real writing brief:
| Level | What it means on a supply chain decisions paper |
|---|---|
| Distinguished | The supply chain decisions paper is specific to the organization or case, applies course concepts accurately with credible sources, and ends in justified conclusions or recommendations. |
| Proficient | The supply chain decisions paper is accurate, but the application or recommendations are general. |
| Basic | The supply chain decisions paper describes concepts with little application. |
| Non-performance | A required part of the supply chain decisions paper is missing. |
Keep the interviewee anonymous unless your courseroom says otherwise.
The BUS FPX 4014 Assessment 3 method, step by step
-
Conduct or review the interview
Questions covering each required topic.
-
Importance of supply chain management
From the manager's perspective.
-
Operations tools
Forecasting, inventory and tracking systems.
-
Alliances and acquisition
Supplier partnerships and sourcing.
-
Integration of components
How parts come together.
-
Just-in-time tradeoffs
Lower inventory against disruption risk.
A structure that maps to the criteria
Word counts are planning targets our tutors use, not Capella rules; follow the length and format your scoring guide states.
| Section | What it must do | Guide |
|---|---|---|
| Introduction | The interviewee in general terms. | ~50 words |
| Supply chain importance and tools | Analysis. | ~150 words |
| Alliances, acquisition and integration | Analysis. | ~150 words |
| Just-in-time tradeoffs | Benefits and risks. | ~125 words |
| Conclusion and references | Then references. | ~50 words |
Annotated sample excerpt
An original model excerpt from our team, written to show the register that reaches the top of the guide. Learn the moves, then write your own version.
The manager described just-in-time as the reason the company carries only a few days of stock, which frees cash and warehouse space that would otherwise sit in inventory.1 The same choice left the company exposed when a supplier's port was closed for a week, and two product lines went out of stock because there was no buffer.2 The tradeoff is not whether to use just-in-time but where to hold safety stock, and the manager's answer, buffers for single-source parts only, reflects the balance the literature recommends.3
- 1States the benefit from the interview.
- 2Shows the risk with an example.
- 3Analyzes the balance with reference to the literature.
The full premium sample for your exact assessment, written fresh to your scoring guide and topic, is free to request. Study it, revise it into your own voice, and submit work you understand.
The five mistakes that cost Distinguished
- Definitions without application. Apply each concept to the organization or case.
- No sources. Cite credible business sources.
- Vague recommendations. Make them specific and justified.
- Answers without analysis. Connect to concepts.
Pre-submission checklist
- Interview conducted or reviewed
- Importance and tools
- Alliances and acquisition
- Integration of components
- JIT tradeoffs
- References
Want the supply chain decisions paper written?
Send the scoring guide and any materials from your courseroom. Our team returns a premium original supply chain decisions paper in 24 to 48 hours, revised free until it meets the guide.