This manual is for BHA FPX 4104 Assessment 2, start to submission. Strategic Analysis and Operational Considerations asks you to analyze competition in the health care industry and the strategic frameworks organizations use to respond: how competition works in health care, frameworks such as SWOT, PEST and Porter's Five Forces, the internal, general and external environments of an organization, and what happens operationally when an organization does not use a framework. The grade turns on applying frameworks to a real organization. Describing SWOT in general scores lower than using it to reach a conclusion about one organization. Below is the method our tutors use, a structure that maps to the criteria, and an annotated sample excerpt. Prefer to hand it off? A premium original sample for this exact assessment comes back in 24 to 48 hours, revised free until it meets the guide. Capella's catalog lists the course as BHA-FPX4104, and some courserooms print BHA4104; both point to this same Assessment 2. In current courserooms this assessment typically appears as "Strategic Analysis and Operational Considerations".
One honesty note before the manual: Capella revises courses and scoring guides over time, so always write to the exact scoring guide attached to your assessment in the courseroom. The course identity above is verified on capella.edu; the method and structure below are our tutors' approach to it, not Capella's official rubric text.
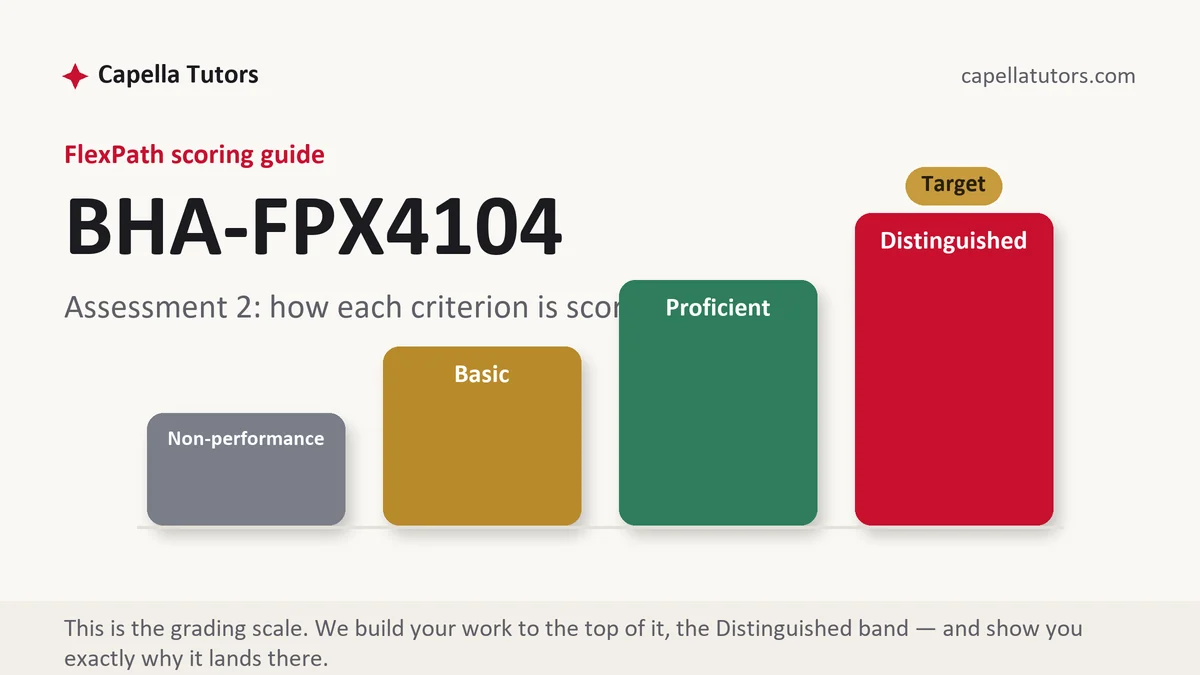
How BHA FPX 4104 Assessment 2 is scored
FlexPath does not use letter grades. Each criterion in the scoring guide lands on one of four levels, and the level descriptions are the real writing brief:
| Level | What it means on a strategic analysis paper |
|---|---|
| Distinguished | Competition in health care is explained with current examples, frameworks are applied to an organization, the three environments are analyzed with evidence, and the consequences of not using a framework are concrete. |
| Proficient | Frameworks are explained accurately, but applied only briefly. |
| Basic | The paper describes frameworks without application. |
| Non-performance | The competition analysis, the environments or the consequences are missing. |
Pick one organization, ideally the one in your courseroom, and use it in every section.
The BHA FPX 4104 Assessment 2 method, step by step
-
Explain competition in health care
Hospitals, retail clinics, telehealth and payer-owned providers competing for patients, staff and contracts.
-
Choose frameworks
SWOT, PEST or Porter's Five Forces, and why each fits.
-
Analyze the internal environment
Resources, capabilities and culture.
-
Analyze the general and external environments
Regulation, economics, demographics, technology and competitors.
-
Show operational implications
How the analysis changes staffing, service lines or investment.
-
Explain the consequences of skipping a framework
Missed threats, poor investments, and examples where possible.
A structure that maps to the criteria
Word counts are planning targets our tutors use, not Capella rules; follow the length and format your scoring guide states.
| Section | What it must do | Guide |
|---|---|---|
| Introduction | Purpose and the organization. | ~75 words |
| Competition in the health care industry | How competition works now. | ~150 words |
| Strategic frameworks applied | Frameworks used on the organization. | ~200 words |
| Internal, general and external environments | Analysis with evidence. | ~175 words |
| Consequences of not using frameworks | Operational risks. | ~100 words |
| Conclusion and references | Close, then current APA. | ~75 words |
Annotated sample excerpt
An original model excerpt from our team, written to show the register that reaches the top of the guide. Learn the moves, then write your own version.
Applied to the community hospital, Porter's Five Forces shows that the strongest pressure is not from the other hospital across town but from substitutes: two urgent care chains and a telehealth service now handle many of the low-acuity visits that used to fill its emergency department.1 Buyer power is also high, because one regional insurer covers nearly half the hospital's commercial patients and can steer them through its network.2 Together these forces point to an operational conclusion the hospital's plan has missed: its growth depends less on adding beds than on partnering with, or competing directly against, the convenient care options patients are already choosing.3
- 1Applies a named force to the organization with evidence.
- 2Adds a second force with a specific fact.
- 3Turns the analysis into an operational conclusion.
The full premium sample for your exact assessment, written fresh to your scoring guide and topic, is free to request. Study it, revise it into your own voice, and submit work you understand.
The five mistakes that cost Distinguished
- Frameworks in general. Apply them to one organization.
- Ignoring substitutes. Health care competition includes new care models.
- Environments listed. Analyze each with evidence.
- No operational link. Say what the analysis changes.
- Vague consequences. Show what goes wrong without a framework.
Pre-submission checklist
- Competition explained with examples
- Frameworks applied to an organization
- Internal, general and external environments analyzed
- Operational implications
- Consequences of not using frameworks
- Current APA references
Want the strategic analysis written?
Send the scoring guide and the organization. Our team returns a premium original paper in 24 to 48 hours, revised free until it meets the guide.