This manual is for BHA FPX 3108 Assessment 2, start to submission. The assessment usually asks you to identify the social and structural conditions behind a population's health results and to quantify how outcomes differ across subgroups, then to carry those findings into whatever you propose. The criteria are watching for one failure in particular: determinants given a respectful paragraph and then forgotten, leaving a plan designed as though nothing in that paragraph were true. Below is our tutors' method, a structure that answers each criterion, and an annotated sample excerpt. Prefer that we drafted it? A premium original sample for this exact deliverable comes back inside 24 to 48 hours, revised at no cost until the guide is satisfied. Capella's catalog lists the course as BHA-FPX3108, and some courserooms print BHA3108; both point to this same Assessment 2.
One honesty note before the manual: Capella revises courses and scoring guides over time, so always write to the exact scoring guide attached to your assessment in the courseroom. The course identity above is verified on capella.edu; the method and structure below are our tutors' approach to it, not Capella's official rubric text.
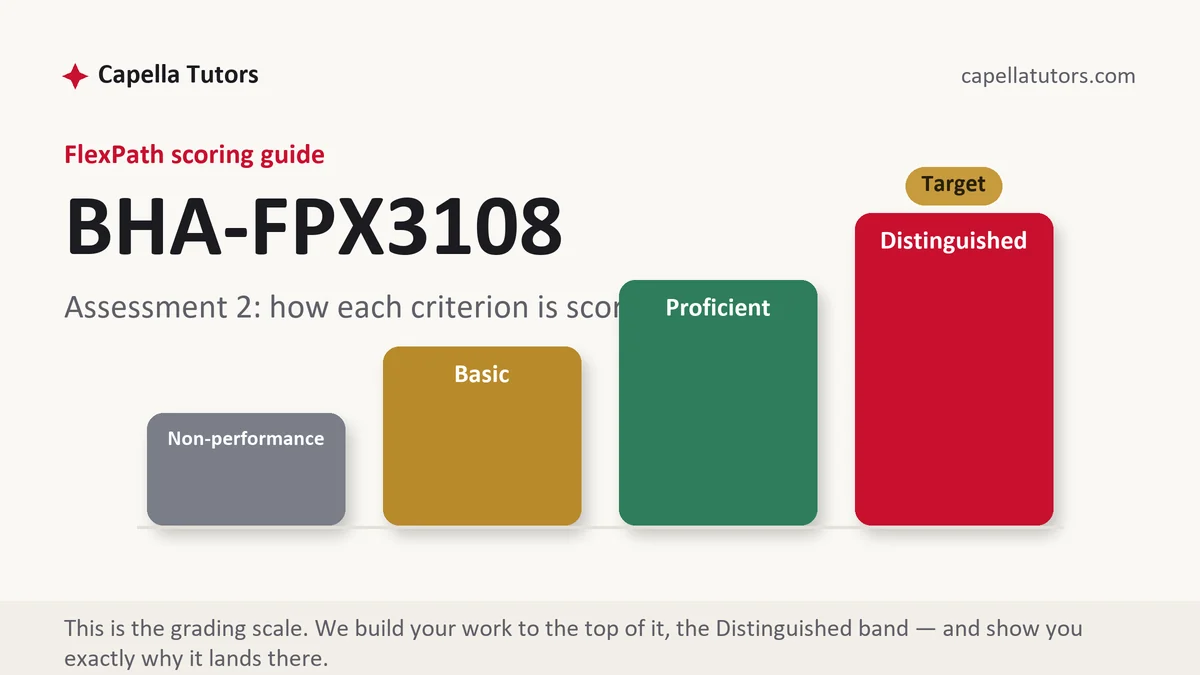
How BHA FPX 3108 Assessment 2 is scored
Each criterion in FlexPath lands on one of four levels, and the level text tells you what the section owes:
| Level | What it means on a determinants and disparities analysis |
|---|---|
| Distinguished | Differences between subgroups are quantified with their data source, the mechanism connecting a condition to the outcome is written out for this setting, association is not dressed up as proof, and at least one design decision visibly follows from the findings. The criterion hides one further move; find it and make it. |
| Proficient | Determinants are identified and disparities are described. Accurate work whose subgroup differences are not measured. |
| Basic | A list of social factors from a textbook, applied to no particular population, followed by a call for greater awareness. |
| Non-performance | A required element is absent, most often the subgroup comparison itself. An empty criterion sits at the floor whatever surrounds it. |
The evidence here is almost entirely observational, because nobody randomizes people into a neighborhood or a housing situation. That evidence is strong enough to act on and loose enough that the wording has to be careful, which is the balance this criterion is really testing.
The BHA FPX 3108 Assessment 2 method, step by step
-
Build headings from the criteria, then pick your subgroups
Decide which splits you will report before you gather anything: age band, payer, language, geography, or the barrier you believe is binding. Choosing the split afterward is how a paper ends up with the subgroups the data happened to offer rather than the ones the question needed.
-
Measure the difference rather than describing it
Report each subgroup's rate with its own denominator and then state the gap in percentage points and in people. A disparity described as significant or troubling has not been measured, and the criterion is asking for a number.
-
Write the mechanism, not the slogan
Instead of asserting that a condition causes an outcome, name the observational evidence, then the plausible local mechanism, then the way it could be tested. That construction gives the evaluator the evidence, its limit and a route to finding out, which is exactly what the top column describes.
-
Check whether age or another structure explains the gap
Before attributing a difference to a social condition, ask what else differs between the groups. Age, sex distribution and time enrolled can produce a whole gap on their own, and a paper that tests for that reads as careful rather than as hesitant.
-
Cite the community data to its source and year
Community assessments, small area estimates and demographic series each belong to an organization and a collection period, and quoting one without either is the fastest way to lose the sourcing criterion. Compilations are legitimate for framing and should be identified as compilations.
-
Make one design decision follow, then self-score
End with something that changes because of what you found: a channel, a time of day, a partner, a language. Then grade each criterion D, P, B or N and rewrite anything under Distinguished before submitting early in the week.
A structure that maps to the criteria
These counts are planning targets our tutors use on a determinants analysis at this level, not Capella rules; give more room to whichever criterion the guide emphasizes.
| Section | What it must do | Guide word target |
|---|---|---|
| The population and the outcome | The group, its denominator, and the outcome whose distribution you are examining. | ~200 words |
| Disparities measured | Each subgroup rate with its denominator, the gap in points and in people, and the source. | ~300 words |
| Determinants present | The social and structural conditions documented in this community, each with a citation. | ~250 words |
| Mechanism and limits | How the condition plausibly produces the outcome here, and what the evidence cannot settle. | ~300 words |
| What changes as a result | One or two design decisions that follow from the findings, and one barrier left unaddressed. | ~200 words |
| References | Assessments and datasets cited with their years, definitional sources credited to their origin. | as needed |
Annotated sample excerpt
An original model paragraph from our team, written at the level the guide's top column describes. Study material: take the sequence, then use your own community.
Among the 1,930 children aged 5 through 17 with a persistent asthma diagnosis attributed to the network, emergency department use in the last twelve months ran at 214 visits per 1,000 children for those living in the three northeast postal codes and 121 per 1,000 for the remainder of the service area, a gap of 93 visits per 1,000 that represents about 61 additional visits a year from a subgroup of 655 children.1 The county assessment documents that 71 percent of housing units in those three postal codes were built before 1960 and that the rental share exceeds two thirds, and the observational literature connecting indoor allergen and moisture exposure to exacerbation is consistent, though it comes from cohorts and cross sectional work rather than from trials.2 The plausible local mechanism is therefore exposure a family cannot remediate because it does not own the unit, which is testable here, since remediation referrals and follow up visit rates are both already recorded.3
- 1Two subgroup rates with a shared denominator convention, the gap in rate terms, and the gap converted into visits a year. Nothing is left as an adjective.
- 2The community data is cited to the assessment and the literature's design is named, so the strength and the limit arrive in the same sentence.
- 3The mechanism is local and specific, and the last clause says how it could be tested with data the organization already holds.
The full premium sample for your exact assessment, written fresh to your scoring guide and issue, is free to request. Study it, revise it into your own voice, and submit work you understand.
The five mistakes that cost Distinguished
- Determinants described then dropped. If the plan would look identical without that section, the section is decoration and the criterion notices.
- Disparities without numbers. A difference has to be reported as rates, a gap and a headcount before it counts as an analysis.
- Causal language over observational evidence. Write the mechanism and name the design, because the literature here is built from cohorts and surveys.
- Subgroups chosen by convenience. The splits that matter come from the question, not from whichever fields the report happened to include.
- Community data quoted as a link. An assessment or a survey needs its publisher and its collection year to be checkable at all.
Pre-submission checklist
- Every criterion has its own section, following the guide's sequence
- Subgroups are chosen from the question and each rate carries its own denominator
- Every gap is stated in points and converted into people
- The mechanism is written for this setting, with the evidence design named
- An alternative explanation such as age structure is considered and addressed
- At least one design decision follows from the findings, and each criterion is self-scored D
Determinants section giving you trouble?
Send the scoring guide, the population and the county you are writing about. We pull the community assessment and the small area estimates ourselves, quantify the subgroup gaps, and write the mechanism so the intervention section has something to stand on. Back in 24 to 48 hours with revision included until the guide is cleared.