This manual is for BHA FPX 3108 Assessment 1, start to submission. The assessment usually asks you to define a population and describe its health with data: an inclusion rule somebody could run, a denominator, a date the membership was fixed on, and then prevalence, utilization and outcome figures set against a wider comparison. Everything later in the course inherits the faults of that first paragraph, which is why the definition is the hard part rather than the intervention. The method is below, followed by a structure mapped to the criteria and an annotated sample excerpt. Rather hand the data work over? A premium original sample built on the geography you name returns in 24 to 48 hours, revised free until the criteria are cleared. Capella's catalog lists the course as BHA-FPX3108, and some courserooms print BHA3108; both point to this same Assessment 1.
One honesty note before the manual: Capella revises courses and scoring guides over time, so always write to the exact scoring guide attached to your assessment in the courseroom. The course identity above is verified on capella.edu; the method and structure below are our tutors' approach to it, not Capella's official rubric text.
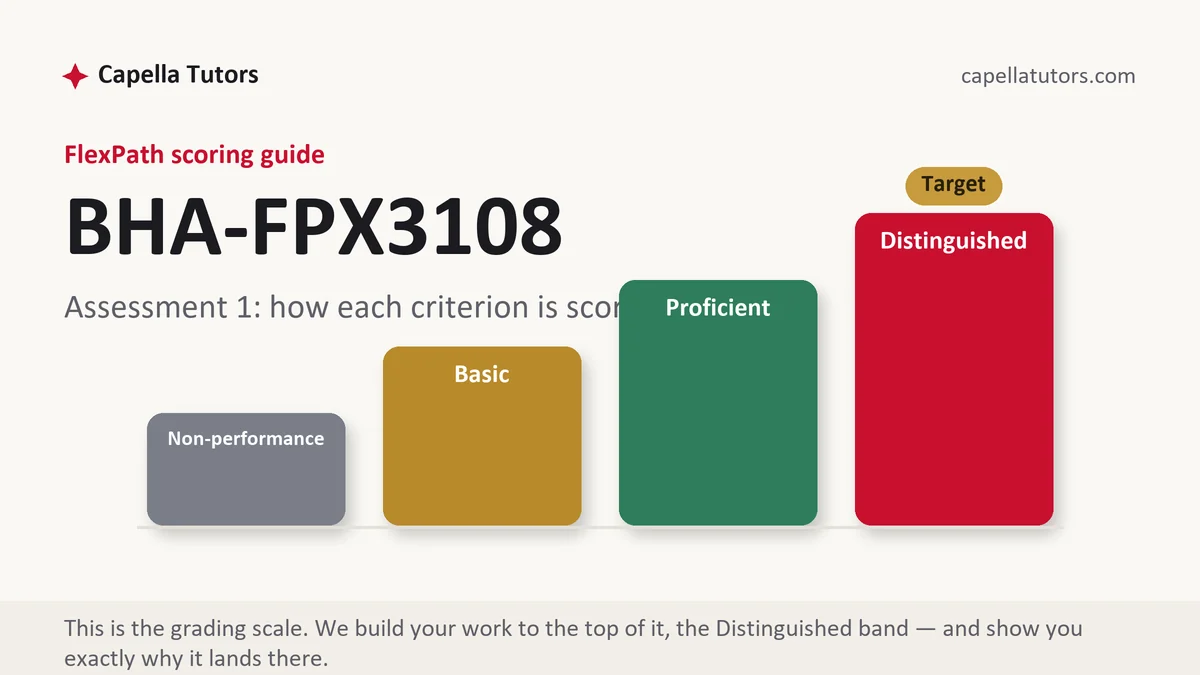
How BHA FPX 3108 Assessment 1 is scored
FlexPath assigns each criterion one of four levels rather than grading the paper, and the level wording is what the section has to satisfy:
| Level | What it means on a population definition and profile |
|---|---|
| Distinguished | The definition could be handed to a data analyst and rerun, every figure carries a numerator, a denominator and a collection year, local values sit against county, state or national series, and percentages are converted back into headcounts. The criterion carries one more move than it appears to; find it and make it. |
| Proficient | The population is defined clearly and the profile is accurate. Correct work whose figures are reported without a comparison. |
| Basic | The community we serve, described with national statistics and no denominator that belongs to the group being discussed. |
| Non-performance | A required element is absent, most often the data source or the enrollment rule. An empty element sits at the floor. |
Decide early whether you hold a panel or a community, because the two behave differently. A panel can be contacted, tracked and measured person by person. A community can be described and reached through partners but never enumerated, so it needs population level measures and cannot promise individual follow up.
The BHA FPX 3108 Assessment 1 method, step by step
-
Criteria into headings before you open a data source
It is unusually easy in this course to spend an afternoon collecting figures for a criterion that does not exist. Build the outline first, keep the Distinguished language visible, and confirm at the end that each section answers its own criterion rather than the one beside it.
-
Write the definition as a rule, not a description
State who is included, who is excluded, the enrollment requirement, the date membership was fixed and where the count came from. Adults 45 and over attributed to a named clinic group, enrolled for at least eleven of the previous twelve months, counted on the first of the quarter, is a rule somebody could run.
-
Establish the denominator before any rate
Count the group first and say how you counted it. Every figure in the profile then hangs from that number, and a profile whose denominators change between paragraphs cannot be assembled into a coherent picture by anybody.
-
Pull local figures from named public series
Use small area and county series and cite them by dataset and collection year rather than as a web address. Where a figure only an employer would hold is required, construct it, label it as constructed, and leave the assumptions visible so the arithmetic can be followed.
-
Compare against something and adjust for age
Set local values beside a county, state or national figure from the same period, and remember that two populations with different age structures cannot have their crude rates compared. Comparing them anyway produces a finding about demographics wearing the label of a finding about health.
-
Convert the gap into people, then self-score
Turn every percentage gap back into a headcount, because a workload can be assigned and a percentage cannot. Then mark each criterion yourself and rewrite anything short of Distinguished before submitting early in the week.
A structure that maps to the criteria
Treat these as planning targets our tutors use for a population profile at this level rather than Capella rules, and expand whichever section the guide weights.
| Section | What it must do | Guide word target |
|---|---|---|
| Introduction and setting | The organization, the service area, and the decision this profile is meant to inform. | ~150 words |
| Population definition | Inclusion and exclusion rules, the enrollment period, the date fixed, the count and its source. | ~250 words |
| Health status profile | Prevalence, utilization and outcome figures with denominators and collection years. | ~350 words |
| Comparison | County, state or national values from the same period, with age structure acknowledged. | ~250 words |
| The gap in people | Each percentage gap converted into the number of individuals it represents. | ~200 words |
| References | Datasets named with their collection years, compilations cited as compilations, current APA. | as needed |
Annotated sample excerpt
An original model paragraph from our team, written where the top of the guide sits. Study material: take the pattern and build it around your own population.
The population is defined as patients aged 45 through 75 attributed to the health center's two rural sites, with at least one office visit in the preceding twenty-four months and no history of colorectal resection, counted from the practice management system on the first of April, which yields 4,860 people.1 Of those, 2,721 have a colorectal cancer screening on record within the interval the recommendation allows for the method used, a screening rate of 56.0 percent, set against 68.4 percent for the state and 71.9 percent nationally in the most recent surveillance year, with both comparison figures drawn from the same series and quoted with that year.2 The twelve point gap against the state is not an abstraction: closing it would mean screening 603 additional people from this panel, which is a workload of roughly fifty completed screenings a month for a year.3
- 1Age range, activity requirement, exclusion, data system and fix date all appear, so another person could reproduce the count of 4,860 exactly.
- 2Numerator, denominator and rate arrive together, and both comparisons come from one series with the collection year named.
- 3The percentage gap is converted into people and then into a monthly workload, which is what makes a profile operational rather than rhetorical.
The full premium sample for your exact assessment, written fresh to your scoring guide and issue, is free to request. Study it, revise it into your own voice, and submit work you understand.
The five mistakes that cost Distinguished
- A population that turns out to be a place. A county is not a denominator you can act on, and every rate built on the phrase we serve is unverifiable.
- Percentages with no headcount behind them. A twelve point gap stays abstract until it becomes the number of people somebody has to reach.
- National figures used as local ones. A national prevalence quoted for a rural panel describes a different group and hides the finding.
- Crude rates compared across different age structures. The demographic difference alone can produce the entire gap you are about to explain.
- Sources given as links. A dataset needs its name and its collection year, and a compilation should be cited as a compilation.
Pre-submission checklist
- Each criterion has a section, and the guide's own order is preserved
- The definition states inclusion, exclusion, enrollment, fix date, count and source
- Every figure carries a numerator, a denominator and a collection year
- Local values are compared against a same-period county, state or national series
- Every percentage gap is converted into a headcount
- Constructed figures are labeled as constructed, and each criterion is self-scored D
Population profile due?
Tell us the county or the panel and send the scoring guide. We pull real public figures for that geography and cite them by dataset and year, so the numbers in your sample are checkable rather than atmospheric. Delivered in 24 to 48 hours, revised at no cost until the guide is met.