This manual is for BHA FPX 2110 Assessment 1, start to submission. Assessment 1 of BHA FPX 2110, Healthcare Operations and Process Improvement, is the drawing stage, and it is stricter than it looks. The assessment usually asks you to take one process somebody actually runs, map it accurately, and measure what it is doing now, which means a start point, a stop point, a unit of analysis held constant, and time recorded in two forms that must not be mixed: the minutes somebody spends working and the minutes the work spends waiting. Get the map wrong and every later section optimizes the wrong step. What follows is the method our tutors run on a process like this, a structure tied to each criterion, and an annotated sample excerpt. Prefer that we drew the current state for you? A premium original sample comes back in 24 to 48 hours, revised without charge until the guide is satisfied. Capella's catalog lists the course as BHA-FPX2110, and some courserooms print BHA2110; both point to this same Assessment 1.
One honesty note before the manual: Capella revises courses and scoring guides over time, so always write to the exact scoring guide attached to your assessment in the courseroom. The course identity above is verified on capella.edu; the method and structure below are our tutors' approach to it, not Capella's official rubric text.
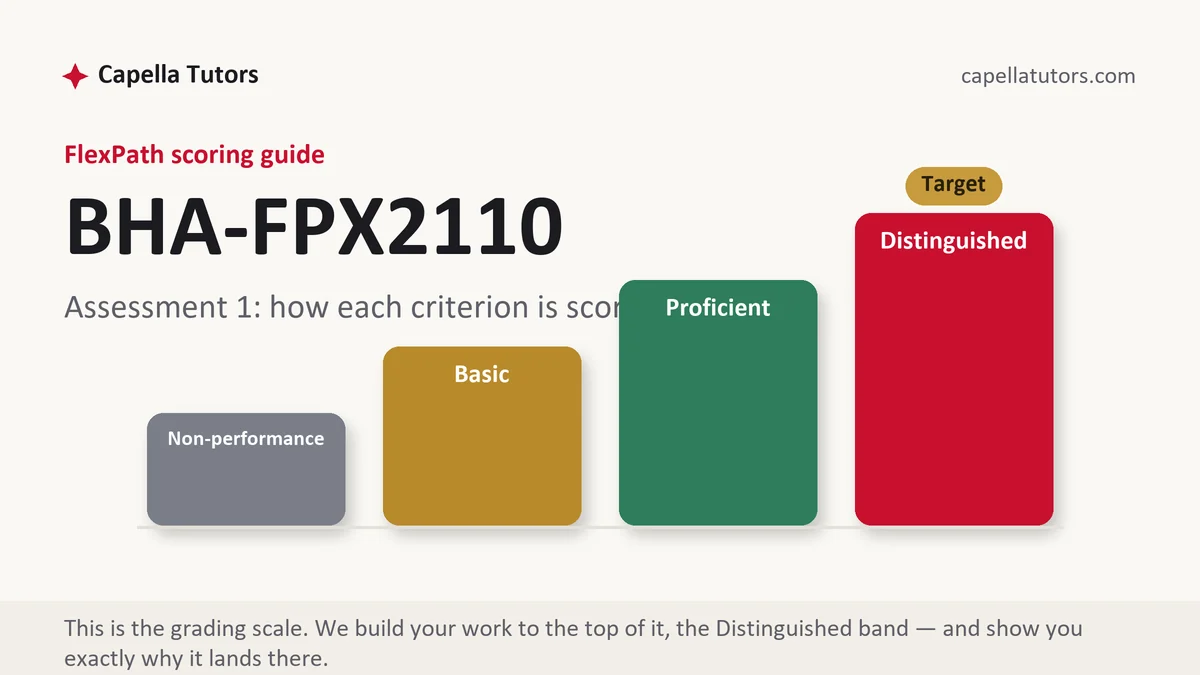
How BHA FPX 2110 Assessment 1 is scored
FlexPath scores each criterion separately at one of four levels, and in an operations deliverable the level language is close to a checklist:
| Level | What it means on a process map and baseline |
|---|---|
| Distinguished | Boundary, unit of analysis, and grain are consistent, waiting time appears alongside touch time, handoffs are placed on the map, estimates are labeled, and the baseline is long enough to show the process varying. |
| Proficient | An accurate map and a correct baseline, with waiting time present but not separated from working time. |
| Basic | A tidy diagram of what is supposed to happen, at mixed levels of detail, with a single week's figure held up as typical. |
| Non-performance | No baseline measurement is provided, or the map has no stated boundary and no unit of analysis. |
One discipline saves this whole deliverable: decide the unit of analysis in the first paragraph and keep every box on the map an event that happens to that unit. If the unit is one patient visit, a box labeled quality improvement is not a step, and an evaluator will find that box before finding anything else.
The BHA FPX 2110 Assessment 1 method, step by step
-
Fix the boundary and the unit before you draw
Write two sentences: this map starts when the patient checks in and stops when the patient leaves the building, and the unit is one scheduled visit. Everything else follows from those two sentences, and most defective maps are defective because nobody wrote them.
-
Walk the process instead of remembering it
Ask the people who do each step what happens next, then follow one case through end to end. The documented process and the real one differ in every department, and the difference is usually where the time is going.
-
Record touch time and waiting time in separate columns
The minutes a step takes and the minutes the work sits in a queue are different quantities with different fixes. In most clinic processes the waiting is the larger half, and a map that captures only the working minutes will send you off to save the wrong six.
-
Put the handoffs on the map
Swimlanes exist to show where work changes hands, not to reproduce the reporting structure. Every lane crossing is a place a queue forms and information gets lost, so mark them, because a criterion asking about handoffs is asking to see them drawn.
-
Build the baseline long enough to show variation
One week is an anecdote. Four to six weeks of the same measure gives you a median and a spread, and it protects you from the classic error of designing an improvement around an unusual Monday.
-
Label every estimate, then self-score
Where you could not obtain a real figure, mark it as an estimate on the map and in the text. Honest estimates cost nothing and unmarked ones cost the credibility criterion. Then grade the draft criterion by criterion and revise anything below the top level.
A structure that maps to the criteria
Word targets below are our tutors' planning figures for a deliverable of this size, not Capella rules. Your scoring guide decides the sections and whether a diagram is required.
| Section | What it must do | Guide |
|---|---|---|
| Scope and unit | The start point, the stop point, the unit of analysis, and who sits inside the boundary. | ~175 words |
| The current state map | The steps in order with handoffs marked, touch time and waiting time kept separate. | ~300 words |
| Baseline measurement | The current performance with numerator, denominator, source, and the period it covers. | ~275 words |
| What the numbers show | The median, the spread, and the tail, with the shape described rather than only the average. | ~250 words |
| Early observations | Where the time is concentrated, stated as an observation rather than as a solution. | ~200 words |
| References | Improvement bodies for method, peer-reviewed operations research for evidence, current APA. | as needed |
Annotated sample excerpt
An original model excerpt from our team, showing a baseline that reports its own shape. Study what it refuses to claim, then write your own.
Across twenty-four clinic days the ophthalmology practice recorded a mean arrival-to-departure time of 96 minutes for a dilated examination, and the mean is the least useful number in that sentence.1 The median was 88 minutes, the interquartile range ran from 74 to 103, and the slowest tenth of visits exceeded 140 minutes, all of them arriving between eight and ten in the morning when three technicians instill drops for two examination rooms.2 Split into its two components the picture becomes actionable: touch time across check-in, workup, dilation instillation, examination, and checkout totals 31 minutes, the mandatory pharmacologic wait accounts for a further 20 to 25 minutes that cannot be removed, and the remaining 40 minutes on a median visit is queueing in front of a room, which is the only one of the three that a process change can reach.3
- 1Reports the mean and then says why it is the weakest figure in the paragraph. Distrust of averages is the habit this course is training, and stating it early earns the analysis criterion room to work.
- 2The shape is given as median, spread, and tail, and the tail is located in a time of day. A tail with a cause attached is what turns description into analysis.
- 3The three components are separated and only one is called changeable. Naming the irreducible part of a process is the honesty that keeps the improvement section realistic.
The full premium sample for your exact assessment, written fresh to your scoring guide and issue, is free to request. Study it, revise it into your own voice, and submit work you understand.
The five mistakes that cost Distinguished
- A map with no waiting time. Touch time is the small half of most clinic processes, and improving it changes almost nothing the patient notices.
- Mixed grain. One box saying rooming and another saying documentation improvement are not the same level of detail, and the map stops meaning anything.
- Swimlanes drawn from the org chart. Lanes show who touches the work, not who reports to whom.
- One week as the baseline. A single week cannot show variation, and everything built on it inherits the accident of that week.
- Unmarked estimates. An estimated figure presented as measured is the fastest way to lose a reader who works in operations.
Pre-submission checklist
- The start point, stop point, and unit of analysis are stated in the text
- Every box on the map is an event that happens to that unit
- Touch time and waiting time are recorded separately
- Handoffs are marked where work changes hands
- The baseline covers enough time to show variation, with source and denominator
- Estimates are labeled as estimates, references reconciled both ways
Process map deliverable due?
Tell us where the work starts, where it stops, who touches it in what order, how long each touch takes, and where it waits. Those five answers are enough to build a defensible current state, and the sample comes back inside 24 to 48 hours with the estimates marked as estimates.