This manual is for RSCH FPX 7864 Assessment 2, start to submission. Correlation Application and Interpretation asks you to analyze relationships among variables in the course data set using the Data Analysis and Application format: a data analysis plan with variables and hypotheses, testing the assumptions of correlation, results and interpretation including a correlation matrix, statistical conclusions with limitations, and application to your field. The grade turns on the full chain from plan to application. Correct output matters, but so do stated hypotheses, checked assumptions and an honest interpretation. Below is the method our tutors use, a structure that maps to the criteria, and an annotated sample excerpt. Prefer to hand it off? A premium original sample for this exact assessment comes back in 24 to 48 hours, revised free until it meets the guide. Capella's catalog lists the course as RSCH-FPX7864, and some courserooms print RSCH7864; both point to this same Assessment 2. In current courserooms this assessment typically appears as "Correlation Application and Interpretation".
One honesty note before the manual: Capella revises courses and scoring guides over time, so always write to the exact scoring guide attached to your assessment in the courseroom. The course identity above is verified on capella.edu; the method and structure below are our tutors' approach to it, not Capella's official rubric text.
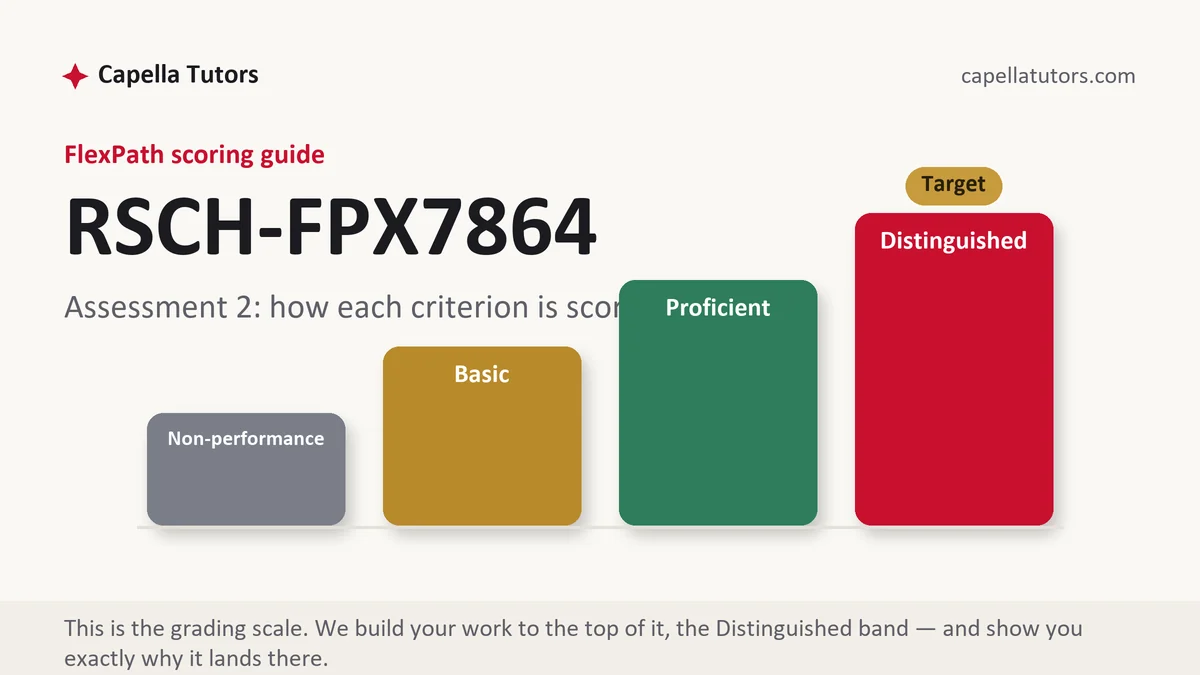
How RSCH FPX 7864 Assessment 2 is scored
FlexPath does not use letter grades. Each criterion in the scoring guide lands on one of four levels, and the level descriptions are the real writing brief:
| Level | What it means on a correlation analysis |
|---|---|
| Distinguished | The correlation analysis is specific to the organization or case, applies course concepts accurately with credible sources, and ends in justified conclusions or recommendations. |
| Proficient | The correlation analysis is accurate, but the application or recommendations are general. |
| Basic | The correlation analysis describes concepts with little application. |
| Non-performance | A required part of the correlation analysis is missing. |
Use the course data set, the DAA template and the software specified.
The RSCH FPX 7864 Assessment 2 method, step by step
-
Write the analysis plan
Variables, measurement levels, hypotheses.
-
Test assumptions
Normality, linearity and outliers.
-
Run correlations
Pearson r for the assigned pairs.
-
Report results
r, p and the correlation matrix in APA style.
-
State conclusions
Reject or retain the null, with limitations.
-
Apply
What the findings mean in your field.
A structure that maps to the criteria
Word counts are planning targets our tutors use, not Capella rules; follow the length and format your scoring guide states.
| Section | What it must do | Guide |
|---|---|---|
| Data analysis plan | Variables and hypotheses. | ~150 words |
| Testing assumptions | Checks. | ~150 words |
| Results and interpretation | Output and meaning. | ~200 words |
| Statistical conclusions and application | Conclusions and use. | ~200 words |
| References | Sources. | as needed |
Annotated sample excerpt
An original model excerpt from our team, written to show the register that reaches the top of the guide. Learn the moves, then write your own version.
GPA and the first quiz score were moderately and positively correlated, r(103) = .45, p < .001, so students with higher GPAs tended to score higher on the first quiz.1 The relationship explains about 20 percent of the variance in quiz scores, since r squared is .20, which leaves most of the variation to other factors.2 Because the data are correlational, the result cannot show that GPA causes quiz performance; both may reflect study habits not measured here.3
- 1Reports the result in APA format and plain language.
- 2Interprets effect size.
- 3States the causal limit.
The full premium sample for your exact assessment, written fresh to your scoring guide and topic, is free to request. Study it, revise it into your own voice, and submit work you understand.
The five mistakes that cost Distinguished
- Definitions without application. Apply each concept to the organization or case.
- No sources. Cite credible business sources.
- Vague recommendations. Make them specific and justified.
- Skipping assumptions. Test them before interpreting.
Pre-submission checklist
- Analysis plan
- Assumptions tested
- Correlations run
- Results reported
- Conclusions and limitations
- Application and references
Want the correlation analysis written?
Send the scoring guide and any materials from your courseroom. Our team returns a premium original correlation analysis in 24 to 48 hours, revised free until it meets the guide.