This manual is for PSYC FPX 3700 Assessment 3, start to submission. The final deliverable in a statistics course often turns outward: instead of analyzing a data set you are handed, the assessment usually asks you to judge numbers somebody else has published, and a reliability review of an existing questionnaire is the version most prompts land on. That work is entirely interpretation. You are asked what a coefficient of .89 licenses, what it does not, and whether a score built on it can carry the decision the manual claims. Below is the method, a criterion-mapped structure, an annotated model excerpt, and the mistakes that cap this paper at Basic. Prefer support? A premium original sample written to your instrument and your guide returns in 24 to 48 hours, revised free until it meets the criteria. Capella's catalog lists the course as PSYC-FPX3700, and some courserooms print PSYC3700; both point to this same Assessment 3.
One honesty note before the manual: Capella revises courses and scoring guides over time, so always write to the exact scoring guide attached to your assessment in the courseroom. The course identity above is verified on capella.edu; the method and structure below are our tutors' approach to it, not Capella's official rubric text.
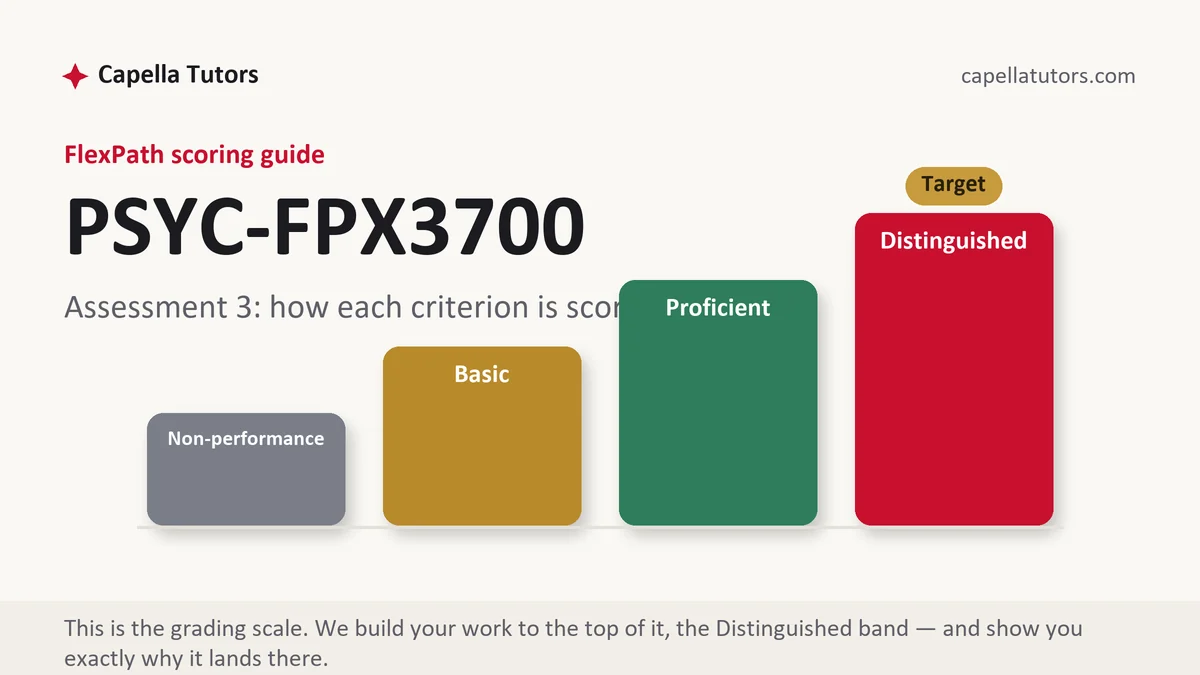
How PSYC FPX 3700 Assessment 3 is scored
Each criterion is judged on its own against four levels, and the wording of the levels is the brief:
| Level | What it means on a measurement review |
|---|---|
| Distinguished | Each coefficient is read as a property of scores in a particular sample rather than of the instrument, the number of items and the population are used to explain the values, error is expressed on the score scale, and the recommendation states which decisions the measure can and cannot support. |
| Proficient | The coefficients are reported and correctly labeled, with the conventional thresholds applied sensibly. What is missing is the argument about the sample or the practical size of the error. |
| Basic | A list of coefficients with adjectives attached, most often the claim that the test is reliable and valid because a single number cleared a familiar cutoff. |
| Non-performance | A required coefficient is absent, reliability and validity are treated as one thing, or no recommendation about use appears. |
The distinction that carries the whole paper is short enough to memorize. Reliability asks whether the scores are stable and consistent. Validity asks whether they mean what the name on the questionnaire claims. A test can be reliable and measure the wrong thing beautifully, so the sentence saying that reliability caps validity without supplying it is worth writing early and once.
The PSYC FPX 3700 Assessment 3 method, step by step
-
Find the technical manual before the review articles
The publisher's manual holds the sample sizes, the norming population, and the coefficients you need, and independent reviews then tell you whether anyone reproduced them. Working from an article that quotes the manual is one remove too many for a paper whose whole subject is where numbers came from.
-
Sort the coefficients by the question each answers
Internal consistency asks whether the items behave as a set on one occasion. Retest correlation asks whether the same people rank similarly weeks later. Agreement between raters asks something else again. Label each value with its question in your own table, because a paper that treats all of them as one score of quality has already lost the analysis criterion.
-
Explain the values with item count and sample
Internal consistency rises as items are added, so a strong figure for a 24-item total and a weaker one for a 4-item subscale is arithmetic rather than scandal. A coefficient also belongs to the sample it came from, which means a value from 612 undergraduates says little about scores from adults in a clinic. Say both things about your instrument.
-
Put the error on the score scale
Convert the reliability into a standard error of measurement, then state what an individual score means with that error attached: a total of 62 on this scale is really 62 give or take about 7, at ordinary confidence. Nothing else in the paper does as much to show you understood the coefficient rather than looked it up.
-
Keep retest change and unreliability apart
A two-week retest correlation of .74 mixes two things: instability in the measurement and real change in the people. Say which you think is doing the work and why, and note that a construct expected to move with circumstances should not be judged by the standard applied to a stable trait.
-
Recommend a use, then self-score
End with a decision rather than an appraisal. Screening a whole class, comparing group averages, and placing one student in a support program need different levels of precision, and your standard error tells you which of those the scores can carry. Then grade every criterion yourself before submitting.
A structure that maps to the criteria
These are the lengths our tutors plan to for a review of this size rather than published requirements, and the error and recommendation rows are the ones that reward extra work.
| Section | What it must do | Guide |
|---|---|---|
| The instrument | What it claims to measure, how many items, how it is scored, and who published it. | ~200 words |
| The evidence base | Each coefficient with its sample size, its population, and the question it answers. | ~300 words |
| Reading the numbers | Why the values are what they are, using item count, sample, and the spread of scores. | ~250 words |
| Error on the score scale | The standard error of measurement, an individual score with its interval, and what that rules out. | ~250 words |
| Reliability against validity | What consistency does not establish, and what evidence of meaning would have to look like. | ~250 words |
| Recommended use and references | Which decisions these scores can support, which they cannot, and current APA both ways. | ~250 words |
Annotated sample excerpt
An original model paragraph from our team, showing how a coefficient gets read rather than reported.
The manual reports internal consistency of .89 for the 24-item total in a norming sample of 612 undergraduates, alongside .84 for the 12-item worry subscale and .58 for a 4-item avoidance subscale.1 The pattern is close to what item count alone predicts, since consistency estimates climb as more items are averaged, so the weak subscale figure is a warning about using four items as a score rather than evidence that those four items are poor.2 Expressed where a user would feel it, the total's coefficient and a norming standard deviation near 11 put the standard error of measurement at about 4 points, which means a student scoring 62 could reasonably have scored anywhere from the middle fifties to the high sixties on another morning, and any cutoff drawn at 60 will therefore sort a sizeable group of students by measurement noise.3
- 1Every coefficient arrives with its item count and its sample. The numbers are attributed to a specific study rather than to the test as a thing that has a quality.
- 2Explains the values instead of grading them, which is the move the analysis criterion pays for, and refuses the easy conclusion about the weak subscale.
- 3Converts the coefficient into points on the scale and then into a consequence for a real decision. This is practical significance in a measurement paper.
The full premium sample for your exact assessment, written fresh to your scoring guide and issue, is free to request. Study it, revise it into your own voice, and submit work you understand.
The five mistakes that cost Distinguished
- Calling the test reliable. Reliability describes scores from a sample, so the sentence needs a who and a when attached to every coefficient.
- Reliable and valid used as one phrase. They are separate questions, and merging them is the error this deliverable is built to catch.
- Cutoffs quoted as law. The familiar thresholds are conventions, and a value has to be argued against the decision it will be used for.
- Ignoring item count. Short subscales produce lower consistency by arithmetic, and a review that misses this misreads its own table.
- No error on the score scale. Without a standard error of measurement, nothing in the paper says what an individual score actually means.
Pre-submission checklist
- Every coefficient reported with its sample size and its population
- Each value labeled with the question it answers, not pooled into one verdict
- Item count used to explain differences between total and subscale figures
- A standard error of measurement, and one individual score shown with its interval
- Reliability distinguished from validity in an explicit sentence
- A recommendation naming supported and unsupported decisions, current APA both ways
Measurement review due?
Send the prompt, the criteria, and the instrument you were assigned. We will pull the technical manual and the independent reviews, read the coefficients rather than list them, and write the recommendation in terms of decisions the scores can carry. Start with a free premium sample.